Key Highlights:
- Out-of-stock items cost retailers $1 trillion globally, and traditional inventory forecasting can’t prevent this.
- Predictive Demand Forecasting in Retail solves this problem with Supply Chain AI, demand sensing AI, intermittent demand modeling, and stockout reduction strategies.
- Predictive demand forecasting delivers 85-95% accuracy, reduces stockouts by 60-80%, achieves 95%+ fill rates, cuts excess inventory by 20-30%, and improves margins by 3-5 points with measurable stockout reduction strategies.
Your best-selling product is out of stock Again.
While your Product Unavailable message displays on screen, your customer is already checking your competitor’s website. That’s not just a lost sale, it’s a customer you may never win back.
The real cost? Retailers lose over $1.2 trillion annually due to out-of-stock items.
In other stats, retailers lose 20% of potential revenue to out-of-stocks every year. For a $1 million business, that’s $200 thousand walking out the door. Add the wasted marketing dollars driving traffic to empty shelves, emergency shipping costs, and the long-term impact of customer churn, and the damage compounds fast.
But you already have forecasting in place. You track sales history. You monitor trends. You set reorder points. Yet stock-outs keep happening.
- It is because traditional demand forecasting looks backward, not forward.
- It assumes next month mirrors last month.
- It can’t react to weather changes, viral social media posts, competitor moves, or supply disruptions.
In today’s volatile retail environment, that backward-looking approach guarantees you’ll always be one step behind.
Predictive demand forecasting in retail changes this. Instead of relying on historical averages, it uses AI-powered demand forecasting for retail stockout prevention by analyzing hundreds of demand signals simultaneously, identifying patterns before they impact your shelves, and adjusting forecasts in real-time as conditions change.
Let’s understand how predictive demand forecasting in retail can help you stop losing 20% to inventory shortages.
Why Out-of-Stock Happens?
You’re doing everything the textbooks say: analyzing sales data, calculating safety stock, setting reorder points. So why are you still facing stock-outs?
The answer is simple, traditional demand forecasting wasn’t built for modern retail’s complexity.
The Real Culprits Behind Stockouts:
1. Demand Volatility You Can’t Predict
Your sales don’t follow neat patterns anymore. A single Instagram post sends demand for a product up 300% overnight. A competitor launches a promotion, and your traffic drops 40%. Unseasonable weather shifts purchasing behavior across entire categories. Traditional forecasting models, built on historical averages, simply can’t keep up.
The result? Your forecast says you need 100 units, but actual demand hits 280.
2. Your Data is Trapped in Silos
Your POS system doesn’t talk to your warehouse. E-commerce operates separately from stores. Marketplace data arrives late. Retailers with siloed systems experience 35% more stockouts because they’re forecasting with incomplete information. You can’t predict demand accurately when you can’t see the full picture.
3. Lead-time Uncertainty and Supplier Variability
You set a reorder point assuming 14-day lead times. Your supplier delivers in 22 days. Or 9 days. Or not at all because of a port delay. Traditional static reorder points can’t account for this variability; they assume consistent, predictable replenishment.
So, forecasting systems still use fixed assumptions that no longer reflect supply chain reality.
4. One-size-fits-all Forecasting
Your forecasting model uses the same logic for bestsellers and slow movers, steady products and seasonal items, predictable SKUs and intermittent ones. This one-size-fits-all approach fails because 40% of retail SKUs have irregular demand patterns that standard models can’t handle.
5. Static Reorder Points Don’t Adapt
Markets shift. Trends emerge. Competitors move. But your reorder points stay frozen until someone manually updates them, usually after you’ve already experienced stockouts.
Manual forecast adjustments take 3-5 days on average, and in fast-moving categories, that lag means you’re always reacting to yesterday’s problems instead of working on stock-out prevention in the future.
Still Losing Revenue to Stockouts? Let X-Byte Analytics Show you Exactly Where Predictive Forecasting can Fix It.
Hidden Costs of Stockouts in Your Retail Store!
Stockouts don’t just cost you one sale. The damage compounds:
- Lost Revenue: The immediate hit, missed transactions that go straight to competitors.
- Substitution Loss: When your product is unavailable, 70% of shoppers leave without buying anything, not even alternatives. You don’t just lose one sale; you lose the entire basket.
- Customer Churn: 43% of customers switch to competitors after experiencing a stockout. You’re not losing today’s $50 sale; you’re losing $2,000+ in lifetime value.
- Negative Reviews: Out-of-stock experiences generate negative reviews at 3x the rate of delivery issues. Each one-star review costs you approximately 30 potential customers.
- Wasted Marketing Spend: You’re paying to drive traffic to products you can’t fulfill. 15-25% of digital ad budgets are wasted on out-of-stock items, clicks that convert to frustration instead of sales.
- Emergency Replenishment Costs: Expedited shipping to cover stockout costs 3-5x standard freight rates, directly eroding margins while signaling broken forecasting.
- Inventory Whiplash: Stockouts trigger panic overordering, creating excess inventory, markdowns, and tied-up working capital, solving one problem by creating another.
The real cost? 20% of potential revenue is walking away while you scramble to catch up.
Check out our Retail Dashboards for a practical example of real-time retail analytics in action.
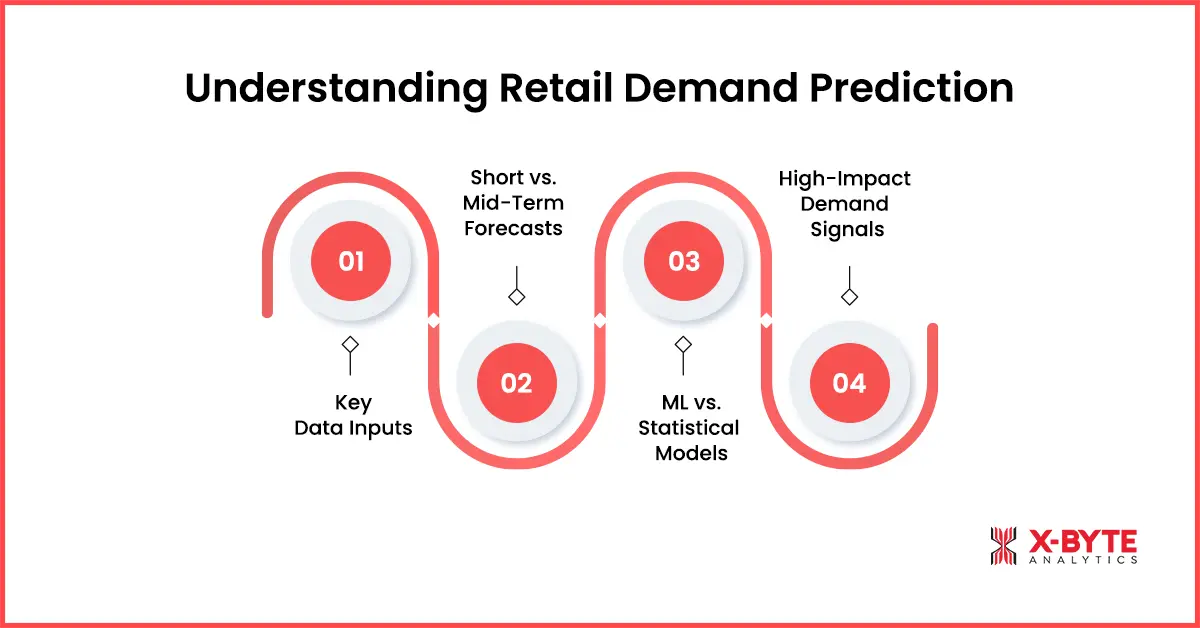
Predictive Demand Forecasting in Retail Explained
Forget the academic jargon. Here’s what predictive demand forecasting to reduce stockouts actually does: it tells you what customers will buy, where they’ll buy it, and when, before it happens.
1. Inputs it Uses
Traditional forecasting looks at one thing: past sales.
Predictive demand forecasting in retail analyzes everything that influences what people buy:
- Sales history across all channels (stores, online, marketplaces)
- Current inventory levels and stock positions
- Promotional calendars and marketing campaigns
- Pricing changes (yours and competitors’)
- Web traffic and search trends are showing early demand signals
- Seasonality and holidays (local and national)
- Supplier lead times and actual delivery performance
- External factors like weather, events, and economic indicators
The system connects these data points to spot patterns. When web traffic for winter coats spikes during an unexpected cold snap, it doesn’t wait for sales to drop before adjusting forecasts; it predicts the surge and triggers replenishment immediately. This same principle applies beyond retail, manufacturing analytics helps in demand forecasting by feeding real-time production and supply chain data into the same predictive models, giving businesses an end-to-end view of demand from factory floor to store shelf.
Forecasting levels:
- SKU-store level: Daily precision for high-volume items at specific locations
- SKU-region level: Efficient forecasting for slower movers with similar regional patterns
- Category level: Strategic insights to improve demand planning to cut 20% stockout losses and vendor negotiations
The system automatically picks the right level based on sales velocity and business impact.
2. Short-term vs Mid-term Forecasting
Different decisions need different forecast windows & your system should forecast across all three horizons simultaneously.
Short-term (daily/weekly): Guides immediate replenishment decisions and helps with stockout prevention on fast-moving items with real-time adjusting.
Mid-term (monthly/quarterly): Drives purchase orders, production planning, and allocation decisions for inventory optimization across your network.
Long-term (seasonal/annual): Informs strategic planning, vendor contracts, and capacity decisions to identify growth opportunities and risks.
3. ML vs Statistical Forecasting
The truth? You need both.
Statistical models work for stable products with predictable patterns, about 60% of your catalog. Machine learning handles the complex 40%: intermittent demand, new products, promotions, and trend-driven items.
The best systems use AI to determine which SKUs need which approach.
4. Demand Signals that Improve Accuracy:
This is where predictive forecasting pulls ahead:
- Promo Uplift Modeling: Instead of guessing promotion impact, the system learns from past promotions & gives you data-driven predictions accordingly.
- Price Elasticity: When you change prices, demand shifts. The system quantifies this & feed directly into forecasts when pricing changes.
- New Product Forecasting: No sales history? No problem. The system analyzes similar products, category trends, marketing spend, and early signals to predict demand for brand-new SKUs.
- Cannibalization and Substitution: When you launch a new flavor, it doesn’t just create new demand; it steals sales from existing flavors. Predictive models account for this & help with inventory optimization accordingly.
Ready to cut Stockouts by 25–30% and Stop Losing 20% of Your Revenue? X-Byte Analytics can Make it Happen.
What Inventory Optimization Success Actually Looks Like?
Predictive demand forecasting to reduce stockouts in retail delivers measurable results:
- 85-95% forecast accuracy across most SKUs, up from 60-70% with traditional methods. That’s the difference between guessing and knowing.
- 95%+ fill rates, customers find what they want 19 times out of 20, consistently.
- 20-30% less excess inventory while improving availability. Free up working capital without sacrificing service.
- 3-5 percentage point margin improvement in the first year from reduced emergency orders, lower carrying costs, and fewer markdowns.
- Faster decision-making, buyers spend 70% less time manually reviewing forecasts and adjusting orders. The system handles routine decisions; your team focuses on strategic exceptions.
- Better supplier relationships and accurate forecasts mean better vendor planning, fewer last-minute changes, and improved negotiating leverage.
The goal isn’t perfect forecasting, it’s profitable forecasting. Knowing with 90% certainty what will sell tomorrow means you confidently stock what customers want while avoiding what they don’t. That’s how you stop losing revenue to inventory shortages and start capturing it.
Walmart’s Reduced Stock-Outs by 25-30% with AI-Powered Demand Forecasting
Walmart, one of the world’s largest retailers, has significantly improved its inventory planning by using predictive analytics and AI-driven demand forecasting across its supply chain.
By integrating advanced machine learning models into its forecasting and inventory systems, Walmart has reduced stockouts by an estimated 25–30%, so products are available when customers need them, and minimizing lost sales. These AI enhancements also contribute to better inventory placement, lower holding costs, and improved customer satisfaction.
Check out our Power BI Inventory Dashboard to see how real-time analytics improves stock visibility and inventory control.
A Practical Step-by-Step Plan to Improve Demand Planning & Cut 20% Stockout Losses!
Predictive AI demand forecasting for retail stockouts may sound complex, but implementation follows a clear path. Here’s how to move from stockouts to inventory optimization in 90 days.
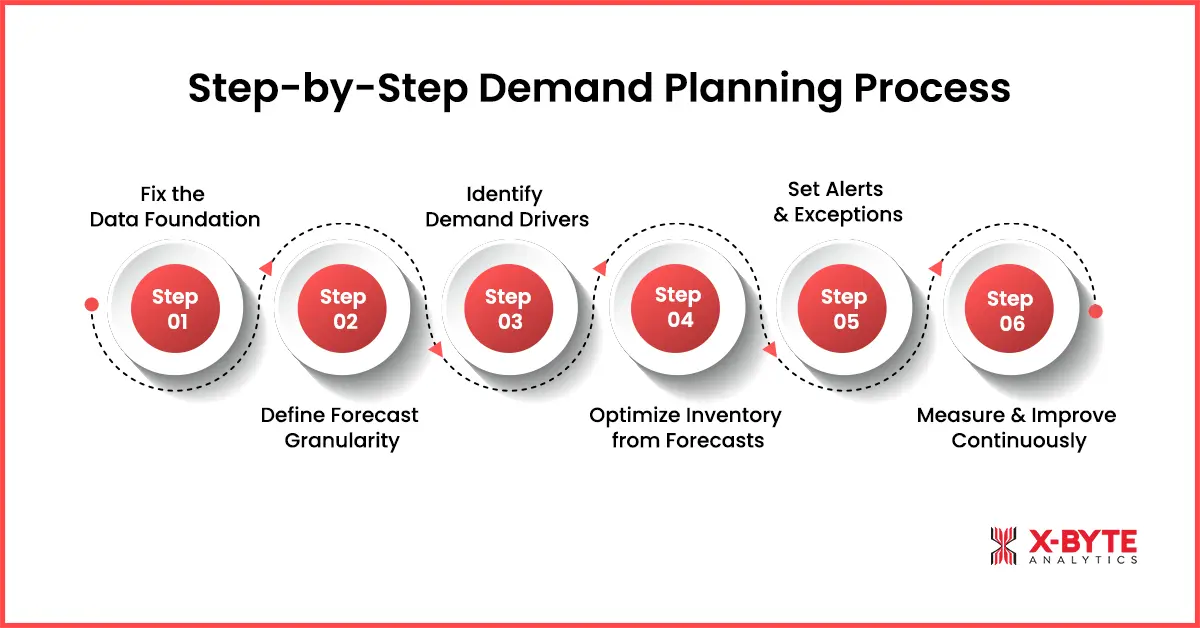
Step 1: Fix Data Foundation
Clean SKU master data: Remove duplicates, fix mismatched units, standardize pack sizes. One product shouldn’t exist as three different SKUs.
Align Product Hierarchy: Make categories and attributes consistent across systems so your model treats Winter Jackets and Cold Weather Coats as the same.
Define Single Source of Truth: Pick one master system for product, inventory, and sales data. Map everything else to it.
Quick Win: This step alone reveals 5-10% of phantom stockouts caused by data errors, not actual inventory problems.
Retailers that implement predictive demand forecasting with the right data structure, SKU segmentation, and AI modeling approach typically see measurable stockout reduction within the first quarter. The key is aligning forecasting models with real supply chain constraints, something we regularly address in our predictive analytics consulting projects.
Step 2: Choose Forecasting Granularity
Start with the top 20% SKUs that drive 80% of revenue. Get this right first, then expand.
Set forecast cadence:
- Fast movers: Daily forecasts
- Medium velocity: Weekly forecasts
- Slow movers: Bi-weekly or monthly
Define scope: High-volume stores get SKU-level forecasts. Smaller stores share regional forecasts.
Step 3: Build Demand Drivers
Feed the system signals that predict demand:
- Promotional calendar: Next 90 days of planned promotions and discounts
- Pricing data: Current prices and planned changes
- Seasonality: Holidays, back-to-school, weather-dependent periods
- External signals: Weather forecasts for seasonal items, local events for event-driven products
More relevant inputs = better predictions.
Step 4: Translate Forecast Into Inventory Optimization
Dynamic reorder points: Replace static levels with smart ones that adjust to demand changes and lead times automatically.
Intelligent safety stock: Calculate buffers based on actual demand variability and supplier performance, not arbitrary rules.
Service levels by category:
- A items (top sellers): 98% in-stock target
- B items (steady movers): 95% target
- C items (slow movers): 90% target
This helps with stockout prevention of slow items while protecting what matters most.
Step 5: Set Alerts & Exception Workflows
Automate detection and response:
- Stockout risk in 7 days alerts: Flags SKUs projected to run out before replenishment
- Supplier delay alerts: Recalculates risk when shipments are late
- Auto-generated replenishment recommendations: Daily prioritized order list for buyers
- Demand spike notifications: Alerts when web traffic or sales velocity suddenly increases
Your team handles exceptions. Automation handles routine decisions.
Step 6: Measure, Learn, and Improve
Track what matters and continuously refine:
Forecast accuracy metrics:
- MAPE (Mean Absolute Percentage Error): Measures average forecast error
- WAPE (Weighted Absolute Percentage Error): Emphasizes accuracy on high-revenue SKUs
- Target: 85%+ accuracy within 90 days
Inventory forecasting performance:
- Fill rate: % of customer demand met from stock (target: 95%+)
- OTIF (On-Time In-Full): % of orders delivered completely and on time
- Lost sales rate: Stop losing revenue to inventory shortages (target: reduce by 60%+)
Financial impact:
- Inventory turns: How quickly stock converts to sales
- Carrying cost reduction: Less excess inventory = lower storage costs
- Working capital freed: Cash no longer tied up in overstock
Bias tracking: Identify if the system consistently over-forecasts (creating excess inventory) or under-forecasts (causing stockouts). Adjust models accordingly.
Review cadence: Weekly for the first 90 days, then monthly once the system stabilizes.
At X-Byte Analytics, we’ve seen that retailers who first fix their data foundation and then layer predictive models on top see faster improvements in forecast accuracy and stockout reduction.
Conclusion
Stockouts aren’t inevitable. They’re the result of forecasting methods that can’t keep pace with modern retail’s complexity.
The difference between losing 20% of your revenue and capturing it comes down to one shift: moving from reactive guessing to predictive intelligence.
With predictive intelligence, our customers find what they need. Your margins stay protected. Your team stops firefighting, and you stop losing revenue to inventory shortages.
The retailers thriving today didn’t get lucky with inventory forecasting. They stopped relying on backward-looking forecasts and started predicting forward.
The technology exists. The ROI is proven. The only question is whether you’ll implement it before your competitors do. If you want to understand where stockouts are costing you revenue, whether predictive demand forecasting makes sense for your retail business, and take the edge before your competitors, then our team at X-Byte Analytics can help you assess the opportunity with predictive analytics consulting for retailers.