Key Highlights:
- This blog explores how Power BI unifies ERP, CRM, WMS, HRMS, and financial data to eliminate silos, giving leaders real-time visibility into operations.
- One will learn how enterprises can reduce hidden cost leakages by automating reporting, forecasting accurately, and addressing operational issues before they escalate.
- Additionally, this blog covers a practical roadmap for implementing Power BI across departments, focusing on clean data models, KPI governance, and the creation of high-impact operational dashboards.
Enterprises today are not losing money because of poor strategy but they’re losing money because of slow visibility. Reports arrive late, departments work in silos, and leaders end up reacting to problems instead of preventing them. In 2025, organizations are adopting Power BI for Operations because they need fast, accurate and unified insights that reveal the truth behind daily performance.
Power BI isn’t just a dashboard tool anymore, it has become a full operational intelligence system that transforms how enterprises monitor performance, optimize cost, and drive continuous improvement.
Why Operations Leaders Are Choosing Power BI in 2025?
Operations leaders want clarity, something spreadsheets and disconnected tools can never deliver. Power BI gives them a real-time view of the entire business, allowing them to act faster, reduce waste, and improve enterprise performance.
• Unified Visibility Across Systems
Power BI brings together ERP, CRM, HRMS, WMS, and finance data in one place. This eliminates blind spots and creates a seamless operational performance dashboard where leaders can see everything like costs, delays, variances, demand, and exceptions.
• Real-Time Insights for Faster Decisions
Instead of waiting for weekly Excel reports, Power BI provides real-time operational analytics. Leaders can instantly detect cost spikes, workflow delays, or inventory gaps and take corrective action immediately.
• Standardized KPIs Across Departments
When finance, operations, and supply chain work on different definitions, decisions suffer. Power BI standardizes KPIs, aligning everyone on the same framework for enterprise performance analytics.
Power BI ultimately gives operations teams the speed, visibility, and governance required to run a predictable, high-performance organization.
Where Enterprises Actually Lose Money?
Cost leakage doesn’t always come from big breakdowns, but it comes from small inefficiencies happening every day. These losses stay hidden because organizations lack unified, timely visibility across processes.
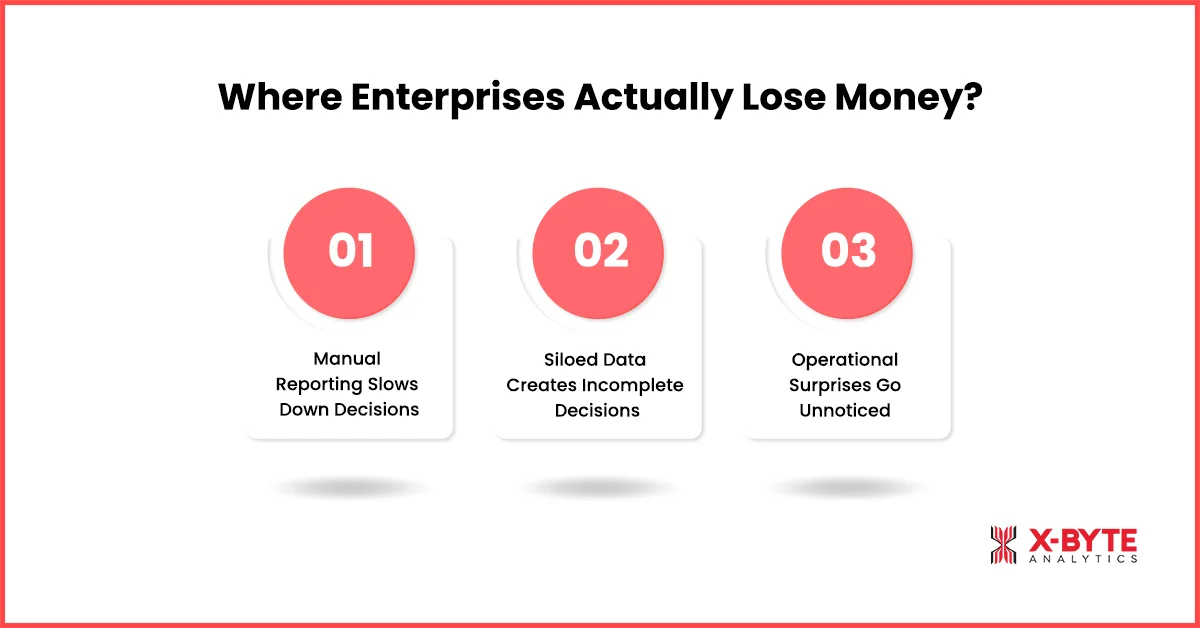
• Manual Reporting Slows Down Decisions
Teams spend hours creating Excel reports that reach leaders too late. Delayed visibility leads to delayed action. Power BI automates reporting, giving leadership instant access to accurate insights without manual effort.
• Siloed Data Creates Incomplete Decisions
When finance, procurement, supply chain, and operations use disconnected systems, insights become fragmented. Power BI consolidates everything into one power bi for enterprise performance model, enabling better and faster decision-making.
• Operational Surprises Go Unnoticed
Breakdowns, stockouts, overtime, vendor delays, are the challenges that becomes predictable when real-time data is missing. Power BI’s alerts and exception-based monitoring help leaders identify issues before they turn into costly problems.
With Power BI, enterprises finally uncover the everyday leaks that silently damage profitability.
How Power BI Becomes the Core of Enterprise Decision-Making?
Power BI has evolved into an essential operational backbone. Instead of juggling 10 different systems, leaders use Power BI as the single source of truth for all operational decisions.
• Centralized Operational Intelligence
Power BI integrates all business systems, giving leaders a holistic view of performance. This is why it is increasingly used as the core operational intelligence system for large enterprises.
• Real-Time Operational Analytics
Leaders instantly see workflow delays, production inefficiencies, or inventory shortages. This real-time clarity enables better planning, faster actions, and reduced risk.
• Automated Workflows with Power Automate
Repetitive reporting and manual notifications disappear. Power BI with Power Automate streamline workflows, reduce manual errors, and cut significant operational overhead.
The ability to combine intelligence, automation, and real-time insights is what makes Power BI indispensable for modern operations teams.
Looking For Decision-Focused Power BI Dashboards? We Create Enterprise-Ready Insights.
Why External Intelligence is Now a Competitive Advantage?
Internal data explains what’s happening inside your business. But to understand why performance changes, enterprises need external intelligence competitor behavior, market shifts, customer sentiment, and price fluctuations.
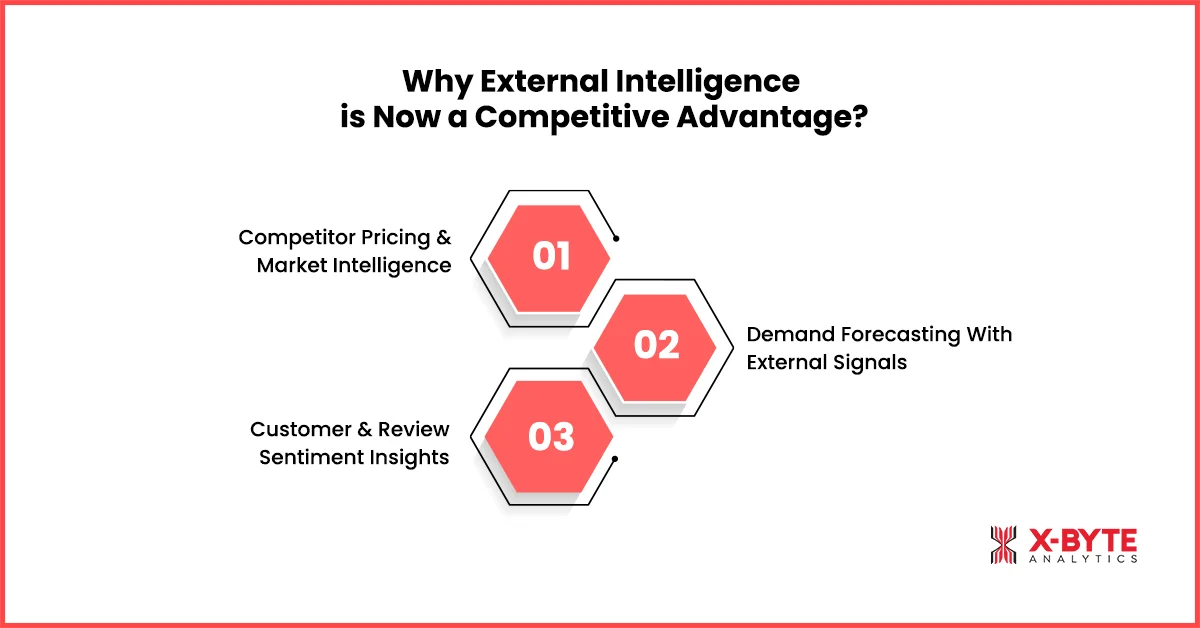
• Competitor Pricing & Market Intelligence
Power BI can integrate external data to build an operational price intelligence system, showing how your prices compare with competitors. This helps enterprises improve pricing strategy and protect margins.
• Demand Forecasting With External Signals
A demand forecasting dashboard becomes far more accurate when external factors like seasonality, regional trends, competitor promotions are layered on top of internal data.
• Customer & Review Sentiment Insights
Power BI reveals customer expectations and product-level sentiment by integrating review analytics. This helps operations and supply chain teams plan better and respond faster.
External intelligence turns Power BI from an internal reporting tool into a true competitive intelligence engine.
Real Enterprise Scenarios Where Power BI Cuts Costs
Power BI creates measurable cost savings across industries by improving visibility and removing inefficiencies.
1. Manufacturing
Companies like Toyota use power bi manufacturing analytics, predictive maintenance, and quality tracking. These dashboards reduce downtime by nearly 15% and improve production performance analysis, cutting waste and saving millions yearly.
2. Retail & eCommerce
Power BI enhances supply chain insights, demand forecasting, and merchandising. Retailers avoid stockouts and overstocks through more accurate planning, reducing holding costs and improving margins.
3. Hospitality & Healthcare
Hotels and hospitals use Power BI to optimize occupancy, patient flow, and staff allocation. Better resource planning leads to reduced operational cost per activity.
4. IT & Shared Services
Power BI tracks usage, licenses, and SLA metrics. Companies eliminate unused tools, improve helpdesk efficiency, and reduce IT spending by 10–18%.
These results show why Power BI is becoming a cost-optimization engine across industries.
A Practical Roadmap to Implement Power BI for Cost Optimization
Implementing Power BI successfully requires a structured approach. Leaders should focus on high-impact areas first and build scalable foundations.
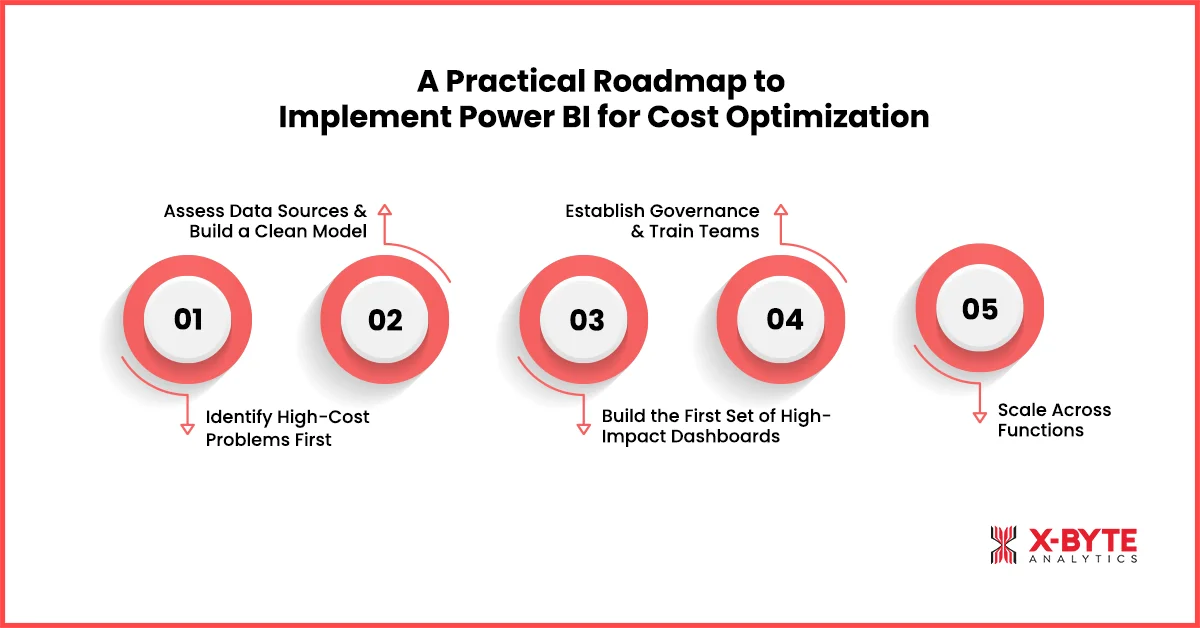
• Identify High-Cost Problems First
Start with operational areas that consistently show cost overruns like downtime, procurement waste, overtime, or poor forecasting.
• Assess Data Sources & Build a Clean Model
Evaluate ERP, CRM, WMS, and financial data. A strong semantic model leads to more reliable forecasting and inventory optimization analytics.
• Build the First Set of High-Impact Dashboards
Create dashboards for cost variance, demand forecasting, production monitoring, and supplier performance. These provide immediate visibility and quick wins.
• Establish Governance & Train Teams
Define KPIs, align metrics, set access rules, and train teams. Governance ensures consistency and long-term accuracy.
• Scale Across Functions
Once validated, expand Power BI across manufacturing, finance, supply chain, and customer service. This enables power bi for finance optimization and true enterprise-wide insights.
A roadmap ensures that Power BI delivers operational value from day one while supporting long-term scalability.
Upgrade Your Operations Analytics With a Custom Power BI Ops Dashboard.
Common Mistakes Enterprises Make and How to Avoid Them
Enterprises typically struggle with Power BI not because of the tool, but because of poor implementation choices.
• Too Many Dashboards Without Ownership
Dashboards become cluttered and outdated when no one owns them. Assigning ownership ensures accountability and proper maintenance.
• Inconsistent KPI Definitions
When every department calculates KPIs differently, insights lose meaning. A centralized KPI dictionary ensures alignment across teams.
• Poor Adoption Across Leadership
Dashboards are often built but never used. Embedding Power BI reviews into weekly and monthly meetings dramatically increases adoption.
• Choosing Partners Who Don’t Understand Data Modeling
Bad data models cause slow dashboards and inaccurate reports. Always work with consultants who understand semantic modeling, forecasting logic, and enterprise architecture.
Avoiding these mistakes ensures that Power BI becomes a reliable and trusted decision-making system.
Conclusion
Organizations cannot afford slow decisions or hidden inefficiencies. Power BI provides the clarity, speed, and intelligence enterprises need to optimize cost, improve forecasting, and gain full control over operations. It unifies systems, standardizes KPIs, and turns real-time insights into measurable business impact.
When implemented with strong governance and the right partner, Power BI becomes more than a reporting tool, as it becomes the operational intelligence backbone of the enterprise.