Quick Summary
- Data analytics transforms raw data into actionable insights for smarter, evidence-based business decisions.
- Key types include descriptive, diagnostic, predictive, and prescriptive analytics, used across industries.
- Proper implementation with tools, KPIs, and governance drives efficiency, growth, and competitive advantage.
Introduction
In today’s digital economy, businesses generate massive volumes of data across operations, marketing, sales, finance, and customer interactions. However, data alone does not create value. The competitive advantage comes from the ability to interpret this data and turn it into decisions that improve performance, reduce risk, and unlock growth.
This data analytics guide is designed to help business leaders, analysts, and decision-makers clearly understand what data analytics is, how it works in practice, and how it supports real business outcomes. Instead of stopping at theory, this guide bridges the gap between analytics concepts and how organizations actually use data to gain a competitive edge.
According to IDC, global data creation is expected to exceed 180 zettabytes by 2025, yet most organizations still struggle to convert this data into actionable insights. This guide addresses that challenge directly.
From our experience working with enterprises across industries, the biggest analytics failures rarely come from lack of data, rather they come from lack of clarity, structure, and alignment between analytics and business goals.
Data analytics is the process of collecting, organizing, analyzing, and interpreting data to uncover meaningful insights that support informed decision-making. It combines data, analytics tools and techniques, and business context to transform raw information into actionable knowledge.
At its core, data analytics enables organizations to move away from intuition-driven decisions and toward evidence-based strategies. Whether the goal is revenue growth, operational efficiency, customer retention, or risk management, analytics provides the factual foundation required for confident action.
Why Data Analytics Matters for Modern Organizations
- Data-driven decisions outperform intuition-based decisions
McKinsey reports that data-driven organizations are 23 times more likely to acquire customers and 19 times more likely to be profitable. Analytics replaces assumptions with measurable insights. - Business complexity demands analytical clarity
As markets become more volatile, relying on static reports is no longer enough. Analytics helps organizations continuously adapt. - Customer expectations are shaped by data
Personalization, faster service, and consistency across channels are powered by analytics-driven insights. - Risk and uncertainty are increasing
From supply chain disruptions to fraud and compliance risks, analytics enables early detection and proactive response. - Analytics is now a strategic capability, not a support function
Leading organizations treat analytics as a core business asset, embedded into planning, operations, and leadership decision-making.
Types of Data Analytics
Understanding the types of data analytics helps businesses progress from basic reporting to advanced, predictive, and prescriptive decision-making. Each type answers a different business question and plays a role in a mature analytics strategy.
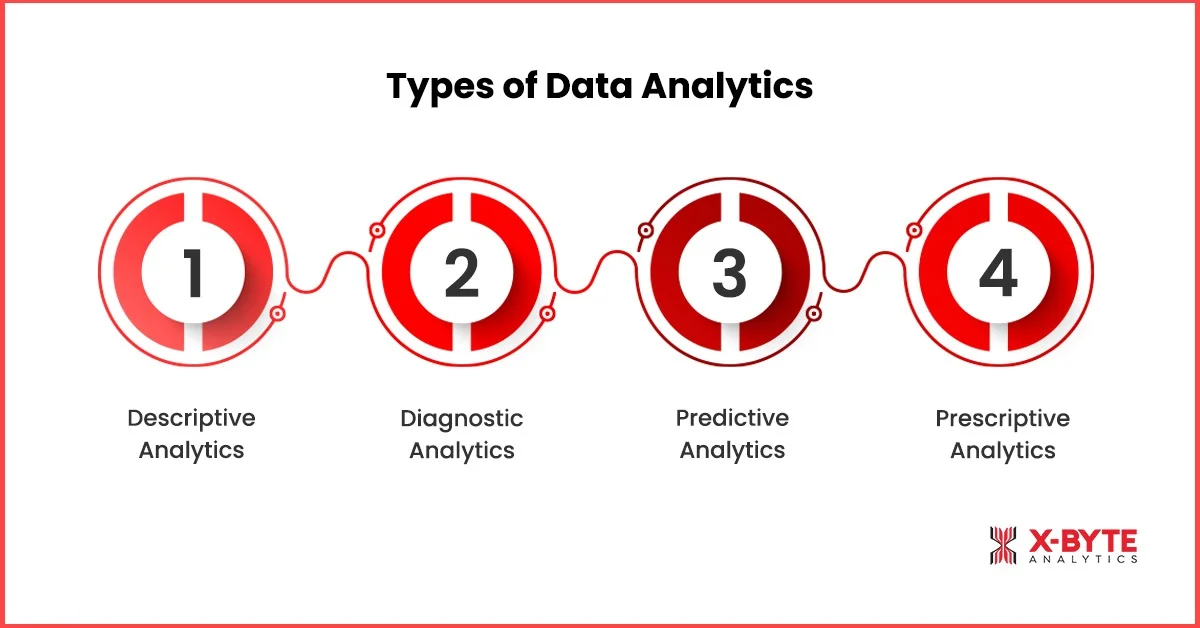
Descriptive Analytics
Descriptive analytics focuses on summarizing historical data to understand past performance.
- Converts raw data into structured reports and dashboards
- Answers questions like “What happened last month?”
- Identifies trends, patterns, and performance benchmarks
- Commonly used in sales, finance, and operational reporting
- Forms the foundation for more advanced analytics
While descriptive analytics does not explain causes or predict outcomes, it provides the visibility organizations need to understand where they stand today.
Diagnostic Analytics
Diagnostic analytics investigates the reasons behind past outcomes.
- Identifies root causes of performance changes
- Analyzes correlations, anomalies, and contributing factors
- Helps teams learn from successes and failures
- Supports process improvement and issue resolution
- Bridges reporting and predictive analysis
Organizations that stop at descriptive analytics often miss opportunities for improvement. Diagnostic analytics turns data into learning.
Predictive Analytics
Predictive analytics uses historical data, statistical techniques, and predictive analytics models to forecast future outcomes.
- Anticipates demand, churn, and customer behavior
- Enables proactive planning instead of reactive responses
- Uses machine learning and forecasting algorithms
- Reduces uncertainty in decision-making
- Supports strategic planning and risk management
Gartner estimates that organizations using predictive analytics improve forecast accuracy by 20–30% on average.
Prescriptive Analytics
Prescriptive analytics recommends optimal actions based on predicted outcomes.
- Evaluates multiple scenarios and trade-offs
- Suggests actions aligned with constraints and objectives
- Supports automation and decision intelligence
- Reduces decision bias and human error
- Maximizes business outcomes using data-backed recommendations
Prescriptive analytics represents the highest maturity level, where analytics actively guides decisions rather than just informing them.
Business Data Analytics and Decision-Making Impact
Business data analytics connects analytics insights directly to strategic and operational decisions. The real value of analytics is not in dashboards, but in better decisions, executed faster.
How Data Analytics Helps Business Decision Making
- Prioritizes initiatives based on measurable impact
- Aligns resources with highest-value opportunities
- Reduces uncertainty in strategic planning
- Improves cross-functional alignment
- Enables consistent, repeatable decision-making
From Reports to Data-Driven Decision Making
True data-driven decision making happens when analytics is embedded into daily workflows. Instead of static reports, insights become part of how teams plan, operate, and execute.
In our client engagements, organizations that embed analytics into operational decisions often reduce decision cycle times by 30-40%.
Maximize Efficiency And Drive Results Using X-Byte Analytics’ Data Analytics Service Solutions Tailored To Your Needs!
Understanding Big Data Analytics
As businesses scale, data from customers, operations, digital platforms, and external sources grows rapidly. Traditional analytics tools often can’t handle this scale and complexity. Big data analytics enables real-time analysis of large, diverse datasets, helping organizations uncover patterns, predict outcomes, and make faster, better decisions.
What Makes Data “Big”?
Data becomes “big” when its volume, speed, and diversity exceed the capabilities of traditional analytics systems. High-frequency data generation, multiple data formats, and increasing complexity require specialized tools and architectures to deliver timely, reliable insights.
Big Data Analytics vs Traditional Data Analytics
| Aspect | Traditional Data Analytics | Big Data Analytics |
| Data Volume | Works with limited, structured datasets | Handles massive volumes of structured and unstructured data |
| Processing Speed | Batch-based or delayed processing | Real-time or near-real-time data processing |
| Data Variety | Primarily structured data (tables, spreadsheets) | Structured, semi-structured, and unstructured data |
| Scalability | Limited scalability as data grows | Highly scalable across distributed systems |
| Advanced Modeling | Basic statistical analysis | Supports advanced modeling and machine learning |
| Data Sources | Mostly internal business systems | Integrates internal and external data sources |
| Decision Impact | Retrospective insights | Faster, predictive, and proactive decision-making |
Data Analytics Process Step by Step
A well-defined data analytics process ensures that insights are accurate, consistent, and aligned with business objectives. Instead of ad-hoc analysis, organizations follow a structured flow that transforms raw data into actionable intelligence. Each step builds on the previous one to support confident, data-driven decisions.
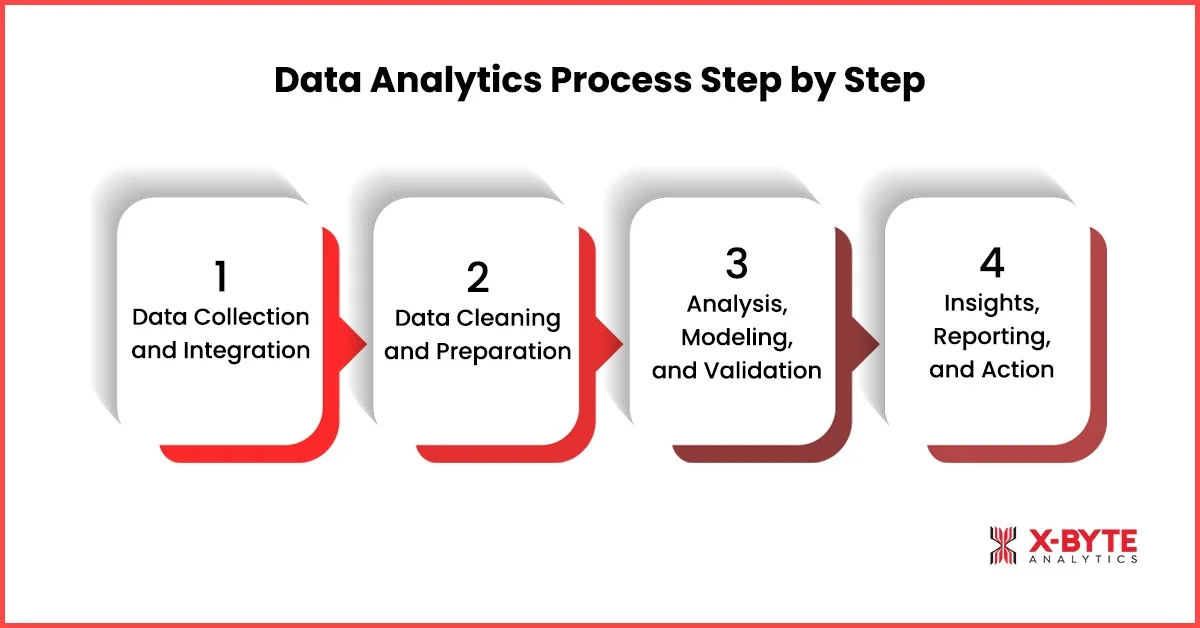
Data Collection and Integration
Data is gathered from multiple sources such as CRM systems, ERP platforms, applications, and external data providers. Integration removes data silos and creates a unified view, enabling consistent analysis across teams.
Data Cleaning and Preparation
Raw data is cleaned to eliminate duplicates, errors, and inconsistencies that can distort results. This step ensures high data quality, improving the reliability of analysis and building trust in insights.
Analysis, Modeling, and Validation
Statistical methods, machine learning, and predictive models are applied to identify patterns and test assumptions. Results are validated to ensure accuracy and refined continuously as new data becomes available.
Insights, Reporting, and Action
Findings are delivered through data visualization dashboards and reports tailored to stakeholders. These insights support faster decisions, align with key business KPIs, and drive measurable outcomes.
Data Analytics Tools and Techniques
Data analytics tools and techniques work together to transform raw data into meaningful business insights. While tools provide the technology to collect, process, and visualize data, techniques define how data is analyzed to uncover patterns, predict outcomes, and support decision-making. Choosing the right combination is critical for building a scalable and effective analytics ecosystem.
Analytics Tools Used in Modern Businesses
- BI platforms for reporting and dashboards
- Programming languages for modeling
- Data processing frameworks for scale
- Cloud platforms for flexibility
- Integration tools for unified data
Analytics Techniques That Drive Insights
- Statistical analysis
- Machine learning models
- Forecasting and time-series analysis
- Data mining
- Optimization techniques
Together, these analytics tools and techniques form the backbone of modern analytics ecosystems, enabling organizations to move from basic reporting to advanced, data-driven decision-making.
Difference Between Data Visualization, Dashboards, and Reporting
Data visualization, dashboards, and reporting are closely related but serve different purposes in the analytics lifecycle. Visualization focuses on presenting data clearly, dashboards enable ongoing performance monitoring, and reporting provides structured summaries of past performance. Understanding the difference helps organizations choose the right approach for faster and more effective decision-making.
Comparison: Data Visualization vs Dashboards vs Reporting
| Aspect | Data Visualization | Dashboards | Reporting |
| Primary Purpose | Simplify and communicate complex data | Monitor performance and KPIs in real time | Summarize historical data |
| Format | Charts, graphs, maps, visual elements | Interactive visual interfaces | Static or scheduled reports |
| Interactivity | Limited or moderate | High (filters, drill-downs) | Low or none |
| Focus Area | Patterns, trends, and anomalies | Ongoing business performance | Past results and summaries |
| Update Frequency | As needed | Real-time or near real-time | Daily, weekly, or monthly |
| Audience | Analysts, teams, stakeholders | Executives, managers, decision-makers | Management, compliance teams |
| Decision Impact | Insight discovery | Operational and strategic decisions | Review and documentation |
Together, data visualization, dashboards, and reporting create a complete analytics communication framework, helping organizations move from understanding data to monitoring performance and taking action.
Data Analytics Use Cases Across Industries
Data analytics is widely applied across industries to improve efficiency, enhance customer experiences, manage risk, and drive strategic growth. By analyzing industry-specific data, organizations can uncover insights that support better decisions, optimize operations, and maintain a competitive advantage in rapidly evolving markets.
1. Retail & E-commerce
Retailers use data analytics to understand customer behavior, optimize pricing, manage inventory, and personalize marketing campaigns. Analytics helps improve demand forecasting, reduce stockouts, and increase customer lifetime value.
2. Healthcare & Life Sciences
Healthcare organizations apply analytics to improve patient outcomes, optimize resource utilization, and support preventive care. Data-driven insights enable better clinical decisions, population health management, and operational efficiency.
3. Manufacturing & Supply Chain
Manufacturers use analytics to forecast demand, optimize production schedules, and reduce downtime through predictive maintenance. Supply chain analytics improves visibility, reduces disruptions, and controls operational costs.
4. Banking & Financial Services
Financial institutions rely on analytics for fraud detection, risk assessment, regulatory compliance, and customer segmentation. Data analytics enhances credit decisions, improves security, and supports personalized financial services.
5. Marketing & Customer Experience
Marketing teams use analytics to measure campaign performance, understand customer journeys, and optimize ROI. Data-driven insights enable targeted messaging, personalization, and improved customer engagement across channels.
How to Implement Data Analytics in Your Organization
Implementing data analytics is a strategic initiative that requires alignment between data, technology, and business goals. A structured approach ensures analytics delivers measurable and sustainable value.
- Define Clear Business Objectives
Start with specific goals such as revenue growth, cost reduction, risk mitigation, or customer retention. Analytics should directly support these outcomes, not operate in isolation. - Identify High-Impact KPIs
Focus on metrics that influence decisions, not vanity metrics. Well-defined KPIs ensure analytics efforts translate into actionable insights. - Centralize and Govern Data
Integrate data from multiple sources into a single, trusted environment. Strong data governance improves quality, consistency, and confidence in analytics outputs. - Enable Adoption Across Teams
Analytics must be accessible and understandable for business users. Training, intuitive dashboards, and clear ownership drive adoption and usage. - Scale with the Right Expertise
Many organizations work with data analytics consulting partners to accelerate implementation, reduce risk, and avoid costly trial-and-error approaches.
Future Trends in Data Analytics
Data analytics is rapidly evolving as organizations demand faster insights, predictive capabilities, and automated decision-making.
- Predictive Analytics Becoming Mainstream
Predictive analytics models are increasingly used to forecast demand, customer behavior, and operational risks with greater accuracy. - AI-Driven Decision Intelligence
AI and machine learning enable analytics systems to recommend actions, not just insights, supporting smarter and faster decisions. - Real-Time and Streaming Analytics
Businesses are moving toward real-time analytics to monitor operations and customer interactions as they happen. - Analytics-Driven Automation
Automation powered by analytics is reducing manual effort and enabling instant responses to changing conditions. - Privacy-First and Responsible Analytics
With growing regulations, organizations are prioritizing data security, compliance, and ethical use of analytics while scaling insights.
Why Businesses Partner with Data Analytics Experts
As analytics environments grow more complex, organizations partner with an experienced data analytics consultant to design scalable data architectures, deploy advanced analytics models, and convert raw data into measurable business outcomes.
- Access specialized expertise for designing scalable and future-ready analytics architectures
- Accelerate implementation of advanced analytics, AI, and predictive models
- Improve data quality, governance, and integration across systems
- Translate complex analytics insights into measurable business outcomes
- Enable faster time-to-insight by leveraging proven analytics frameworks and best practices
- Reduce risk, cost, and time associated with trial-and-error analytics initiatives
- Ensure analytics initiatives stay aligned with evolving business and technology needs
- Support long-term scalability as data volume, users, and use cases grow
Partner With X-Byte Analytics To Harness The Full Potential Of Data Analytics Service And Drive Business Growth.
Conclusion: Turning Data into a Competitive Advantage
Data analytics is no longer optional, it is a strategic necessity. Businesses that invest in analytics gain clarity, agility, and confidence in decision-making. With the right approach, tools, and expertise, analytics transforms data into a sustainable competitive advantage.This data analytics guide for businesses provides a clear foundation for understanding how analytics works and how it can be applied in real-world scenarios. By covering analytics types, processes, tools, use cases, and implementation best practices, it helps organizations move beyond basic reporting toward data-driven decision making. With the right strategy and execution, businesses can progress from simple data awareness to true data mastery, where insights consistently drive growth, efficiency, and long-term competitive advantage.