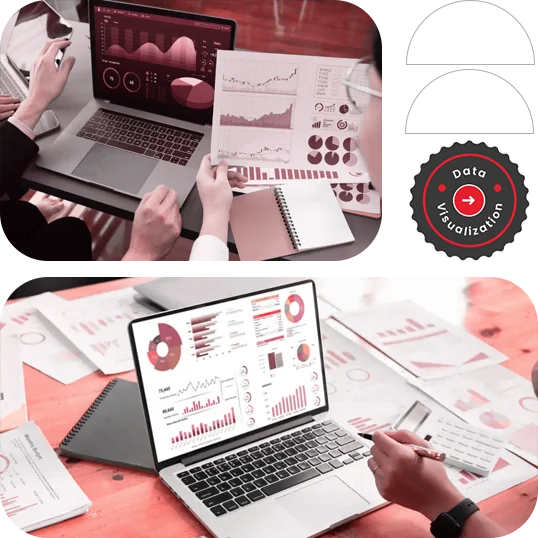
Top Data Visualization Services in the USA for Smarter, Faster Decision-Making
At X-Byte Analytics, our data visualization consulting services in the USA transform scattered data into powerful dashboards that elevate how your organization understands and analyzes information. Each visual supports strategic decision-making across departments and workflows. From analysts to team leads, your users gain clearer visibility into trends and performance. Our data visualization experts deliver solutions that reduce guesswork, improve efficiency, and help you move forward with confidence.

Trusted by conglomerates, enterprises, and startups


Boost Your Analytics with Professional Data Visualization Services in the USA

At X-Byte Analytics, our data visualization consulting services in the USA help businesses convert complex datasets into clear, actionable insights. With interactive dashboards and intuitive reports, your teams can make smarter, faster decisions backed by accurate data. As one of the top data visualization companies in the USA, we build tailored dashboards that give executives and decision-makers real-time visibility into trends, performance indicators, and business opportunities.
High-quality visualization is essential for improving operational efficiency and strengthening strategic planning. With deep expertise in modern BI platforms and advanced analytics, X-Byte Analytics delivers custom dashboards and reports that unify data from multiple sources. Our automated data visualization solutions make information accessible across your organization, helping teams reduce manual effort and improve decision-making speed.
By integrating industry-leading visualization tools, businesses can simplify analysis, enhance reporting accuracy, and uncover insights that drive measurable impact. Our team ensures every visualization supports your goals—offering clarity, precision, and scalability across all levels of your data architecture. If you’re looking for reliable and scalable data visualization services in the USA, X-Byte Analytics helps you leverage your data with confidence.
Custom Data Visualization Services in USA We Offer
As one of the leading data visualization companies in the USA, X-Byte Analytics transforms complex datasets into clear, interactive visualizations. Our data visualization services in the USA help businesses simplify analysis, eliminate silos, and interpret large data volumes with custom dashboards and intuitive reporting.
Dashboard Design & Development
Data Visualization Optimization
Power BI Strategy & Consulting
Tableau to Power BI Migration
Cloud Data Visualization Services
Real-Time Analytics & Monitoring
Contact Us Today
Our Streamlined Data Visualization Process
As one of the top data visualization companies in the USA, X-Byte Analytics delivers a structured process that ensures accuracy, speed, and clear business insights. Our data visualization services in the USA are designed to create interactive dashboards and reports that help decision-makers analyze data with confidence.
Understand Requirements and Plan
We begin by analyzing your business goals and visualization needs. Our data visualization consulting services in the USA help you define KPI requirements, user journeys, and dashboard priorities—ensuring every visualization aligns with your strategic objectives.
Data Collection and Analysis
Our team collects and integrates data from multiple sources using advanced analytics tools. As a leading data visualization agency in the USA, we clean, standardize, and prepare your data to ensure smooth, accurate, and reliable analysis.
Visualization and Reporting
Once the data is prepared, we create interactive dashboards and reports tailored to your workflow. Using modern BI platforms and cloud-ready tools, we transform complex datasets into clear, actionable visuals that support fast decision-making.
Implementation and Monitoring
After building your dashboards, we implement them across your cloud or on-premise environment for real-time access. As part of our data visualization services in the USA, we continuously monitor performance to ensure seamless, uninterrupted analytics.
Support and Continuous Improvement
Our experts provide ongoing support, training, and optimization to ensure your dashboards stay relevant as your business evolves. We refine visualizations, update data models, and help your teams adapt to new needs—ensuring long-term value and consistent insight delivery.
Recognitions and Partnerships
Case Studies
Streamlining Financial Reporting for a Manufacturing Firm
Overview
A mid-sized manufacturing company facing issue with time-consuming financial reporting processes and lacked visibility into key performance indicators. They sought a solution to automate reporting and provide better analytics.
Challenges
Solutions
X-Byte Analytics has implemented power BI to build interactive dashboards to monitor cash flow, revenue, expenses, and profitability. They have consolidated data to automate and optimize financial reporting which provided 50% improved data accuracy.
Enhancing Sales Analytics for a Retail Chain
Overview
Well known retail chain faced challenges in tracking and analyzing sales performance across multiple outlets. They required unified system to monitor real-time sales data and evaluate product performance effectively.
Challenges
The data was scattered across disparate systems, making it hard to generate consolidated reports. They were also making manual reporting and having lack of insights into customer preferences and buying patterns.
Solutions
Using Power BI, we have developed a centralized dashboard to track sales trends, product performance, and customer demographics. This provided real time updates and Integrated data from POS systems, inventory databases, and CRM platforms.
Expanding Opportunities In All Types Of Industries
Get in Touch
Why Choose X-Byte Analytics for Custom Data Visualization Solutions
X-Byte Analytics is recognized as one of the top data visualization companies in the USA, delivering interactive dashboards and custom BI solutions that simplify decision-making. With our data visualization services in the USA, businesses gain access to expert resources, scalable visualization capabilities, and streamlined analytics without the cost of building in-house teams.
Our certified specialists bring deep expertise across leading visualization tools like Power BI, Tableau, Looker, and D3.js. As a trusted data visualization consulting service provider in the USA, we integrate diverse datasets and create responsive charts, maps, and dashboards tailored to your analytics goals.
We build interactive visuals that deliver real-time insights across devices and user roles. With our custom data visualization solutions, organizations can access reports anytime, monitor KPIs, and drive faster decisions with intuitive, user-centric interfaces.
As a top data visualization agency in the USA, we design mobile-optimized dashboards with cross-platform compatibility. Our team ensures every visualization is responsive, easy to navigate, and visually consistent across smartphones, tablets, and desktops.
Outsourcing your visualization needs to X-Byte Analytics eliminates the overhead of managing in-house BI infrastructure. Our data visualization cloud services reduce operational costs while ensuring efficient access to dashboards and automated reports.
We follow strict compliance and security measures to safeguard your information. Our data visualization and analytics services help reduce data handling risks, ensuring confidentiality through secure pipelines and enterprise-grade protection.
We provide continuous support, improvement, and maintenance to keep your dashboards high-performing and aligned with evolving business needs. Our team ensures your BI ecosystem remains accurate, reliable, and ready for real-time decision-making.
Frequently Asked Questions
What makes X-Byte Analytics one of the top data visualization companies in the USA?
X-Byte Analytics stands out due to our expertise in Power BI, Tableau, Looker, and advanced BI frameworks. We provide end-to-end data visualization consulting services in the USA, offering custom dashboards, automated reporting, real-time analytics, and cloud-ready solutions tailored to your business needs.
What industries do you serve with your data visualization consulting services in the USA?
We support a wide range of industries, including healthcare, finance, retail, manufacturing, logistics, SaaS, eCommerce, and more. Our industry-specific dashboards help companies visualize KPIs, trends, and performance metrics that matter most to their operations.
Do you offer custom dashboards as part of your data visualization services in the USA?
Yes. We design fully customized dashboards based on your goals, data sources, and reporting needs. Our team creates interactive visuals, drill-down insights, and mobile-friendly BI dashboards that enable fast, informed decision-making.
Can you help migrate existing dashboards to modern BI tools like Power BI?
Absolutely. We provide seamless migration services, including Tableau to Power BI migration, ensuring your dashboards, data models, and visualizations are accurately reconstructed. Our migration process enhances scalability, lowers costs, and improves integration with Microsoft tools.
How do your data visualization services help businesses improve decision-making?
Our visualization solutions convert complex datasets into easy-to-understand charts, graphs, and real-time dashboards. By presenting key insights visually, decision-makers can spot trends, track KPIs, identify risks, and take action faster—resulting in improved business performance and efficiency.


