Data analytics services cost in 2026 depends on project scope, data sources, dashboard complexity, integrations, AI requirements, and support needs. Basic BI dashboards cost less, while enterprise analytics projects require data engineering, cloud architecture, governance, and predictive analytics. Businesses should compare pricing with ROI, reporting speed, accuracy, and operational efficiency.
Introduction
Data analytics services cost in 2026 is not only about hourly rates or dashboard pricing. Instead, it depends on your business goals, data maturity, reporting gaps, integrations, and ROI expectations. For many companies, the bigger cost is not analytics investment. It is delayed reporting, poor visibility, manual spreadsheet work, and decisions made without trusted data.
As a result, more companies are investing in data analytics consulting services, business intelligence services, Power BI consulting services, and predictive analytics solutions. However, before choosing a vendor, buyers need a clear view of pricing, scope, deliverables, and expected business value.
Want to estimate your analytics project cost? Share your data sources, reporting goals, and dashboard requirements to get a custom analytics scope review from X-Byte Analytics.
Why Data Analytics Investment Is Growing in 2026?
Data analytics has moved from a support function to a growth driver. Today, leadership teams want faster reporting, real-time dashboards, cleaner data, and predictive insights. Therefore, businesses are no longer satisfied with monthly Excel reports or disconnected departmental dashboards.
Statistic Callout Box: Market Growth Insight
The global business intelligence market was valued at $34.82 billion in 2025. It is projected to grow from $37.96 billion in 2026 to $72.21 billion by 2034, which shows strong long-term demand for BI and analytics adoption.
Source: Fortune Business Insights
Key Reasons Businesses Are Investing in Analytics
- Faster access to business-critical KPIs
- Reduced manual reporting work
- Better sales, finance, marketing, and operations visibility
- Improved forecasting and decision-making
- Stronger data governance and reporting accuracy
- AI-ready data infrastructure for future analytics use cases
Moreover, analytics adoption is increasing because companies now need decision-ready data across departments. Sales, finance, operations, marketing, and leadership teams can no longer work with isolated numbers. Therefore, a structured analytics system helps businesses reduce confusion and act faster.
Average Data Analytics Services Cost in 2026
The average data analytics services cost in 2026 varies widely because project scope changes from company to company. A small dashboard project may require data cleaning, visualization, and basic automation. However, an enterprise analytics project may include data pipelines, warehousing, role-based access, predictive models, and ongoing monitoring.
Pricing Benchmark
Clutch reports that the average cost of hiring a business intelligence, big data, and analytics consultant on its platform commonly ranges between $25-$49 per hour. Final pricing still depends on the support type, business problem, data volume, and project complexity.
Source: Clutch
Clear Data Analytics Services Cost Range in 2026
For planning purposes, businesses can use the following indicative cost ranges. These ranges are not fixed packages. Instead, they help buyers understand how scope, data complexity, and delivery model affect budget planning.
| Project Scope | Indicative Cost Range | Best Fit |
|---|---|---|
| Basic analytics dashboard | $3,000-$10,000 | Single dashboard, limited data sources, basic KPIs |
| Department-level BI implementation | $10,000-$35,000 | Sales, finance, marketing, or operations dashboards with integrations |
| Data engineering + BI setup | $25,000-$75,000 | ETL pipelines, data warehouse, dashboard modeling, governance |
| Enterprise analytics ecosystem | $75,000-$200,000+ | Multiple departments, cloud architecture, role-based access, predictive analytics |
| Managed analytics support | $2,000-$15,000/month | Dashboard maintenance, refresh monitoring, improvements, support |
How We Estimated These Data Analytics Pricing Ranges?
| Factor | Example |
|---|---|
| Data Sources | CRM, ERP, ecommerce, finance systems |
| Dashboard Count | 1 dashboard vs multi-department BI system |
| Integration Complexity | API, warehouse, manual data import |
| Support Level | One-time setup vs monthly support |
| AI/ML Requirement | Forecasting, anomaly detection, predictive models |
Pricing Disclaimer: Use These Ranges for Planning Only
These pricing ranges are indicative estimates for budget planning. Actual data analytics services cost may vary based on data complexity, number of integrations, dashboard count, BI tool selection, data quality, security requirements, AI/ML scope, support needs, and delivery timelines. A detailed scope review is recommended before final pricing is confirmed.
Data Analytics Pricing Based on Business Size
Business size is another important pricing factor. Small businesses usually need faster dashboard visibility, while mid-sized companies often need cross-functional reporting. Large enterprises may need governance, cloud architecture, predictive analytics, and ongoing optimization.
| Business Size | Typical Analytics Need | Indicative Budget Range | Recommended Engagement |
|---|---|---|---|
| Small Business | Basic KPI dashboards, sales reports, manual reporting automation | $3,000-$15,000 | Fixed-price dashboard project |
| Medium Business | Multi-source BI dashboards, data integration, Power BI reporting, department-level analytics | $15,000-$60,000 | Fixed-price project plus monthly support |
| Large Business / Enterprise | Enterprise BI, data warehouse, governance, predictive analytics, role-based access, cloud setup | $60,000-$200,000+ | Phased implementation with managed analytics support |
This pricing view helps leadership teams align analytics investment with business maturity. Additionally, it prevents overbuying advanced solutions before data readiness is strong enough to support them.
Data Analytics Pricing Models Compared
Most data analytics companies use one of four pricing models: fixed price, hourly price, monthly support, or in-house hiring. The right model depends on scope clarity, internal capabilities, timeline, and how much ongoing improvement is needed.
| Pricing Model | How It Works | Best For | Buyer Consideration |
|---|---|---|---|
| Fixed Price | A defined scope is priced before delivery begins. | Dashboards, BI implementation, defined data integration projects | Best when requirements, data sources, and deliverables are clear. |
| Hourly Price | The provider billsbasedon consulting or development hours. | Audits, troubleshooting, advisory,small changes, flexible work | Good for flexibility, but scope control is important. |
| Monthly Support | A recurring monthly fee covers maintenance, enhancements, refresh checks, and reporting support. | Growing teams with evolving dashboard and reporting needs | Useful after launch to keep reportsaccurateand relevant. |
| In-House Price | The company hires internal analysts, BI developers, or data engineers. | Long-term analytics ownership and daily internal reporting support | Adds salary, hiring, training, tools, and management costs. |
Pricing Model Insight
WebFX reports 2026 big data consulting rates around $200-$350 per hour and notes that in-house data scientist salaries may range from $54,000-$140,000 per year. This highlights why many companies compare outsourced consulting with in-house analytics hiring before choosing a model.
Source: WebFX
Not sure whether fixed price, hourly consulting, monthly support, or in-house hiring fits your analytics project? Share your data sources, dashboard goals, and reporting challenges. X-Byte Analytics can help you choose the right engagement model with a practical cost estimate.
What Affects Data Analytics Pricing?
Several factors affect data analytics pricing. Therefore, buyers should define the scope before requesting a quote. Otherwise, two vendors may provide very different estimates for what appears to be the same project.
Main Pricing Factors
- Number of data sources: CRM, ERP, ecommerce, finance, marketing, and operations systems increase integration work.
- Data quality: Messy, duplicate, or incomplete data requires more cleaning and validation.
- Dashboard complexity: Executive dashboards cost less than multi-role, multi-department BI ecosystems.
- Refresh frequency: Real-time or near-real-time reporting usually increases technical effort.
- Security needs: Role-based access, audit trails, and governance add architecture work.
- AI requirements: Forecasting, anomaly detection, and predictive analytics require deeper modeling.
- Support model: One-time development costs less than continuous analytics support.
Additionally, tool selection matters. Power BI, Tableau, Looker, cloud warehouses, and custom analytics platforms each bring different licensing, setup, and integration considerations. As a result, businesses should prepare a clear requirement list before discussing pricing.
What Should Be Included in the Scope?
A strong data analytics project should not start directly with dashboard design. Instead, it should begin with discovery, KPI mapping, and data source evaluation. This helps the analytics partner understand what the business actually needs to measure.
Integration Planning Insight
Gartner describes analytics and business intelligence platforms as solutions that help organizations model, analyze, and visualize data. These platforms also support data integration from databases, spreadsheets, cloud services, and external feeds to create a unified view.
Source: Gartner
Ideal Data Analytics Project Scope
- Business goal discovery
- KPI and reporting requirement mapping
- Data source audit
- Data cleaning and transformation
- ETL pipeline or integration setup
- Dashboard wireframe and UX planning
- BI dashboard development
- Data validation and QA
- User access and permission setup
- Documentation and training
- Post-launch support and optimization
This structure improves delivery quality. Moreover, it helps avoid one of the most common analytics problems: dashboards that look good but do not answer real business questions. Therefore, scope planning should always come before dashboard development.
Data Analytics Services Pricing by Business Need
Different business goals require different analytics investments. Therefore, companies should match pricing with expected value instead of comparing only hourly rates. For example, a sales dashboard and a predictive inventory model cannot be priced the same way.
Reporting Automation
- Automated data refresh
- KPI dashboards
- Scheduled reports
- Spreadsheet replacement
- Basic data validation
This is often the fastest ROI opportunity because it saves time immediately. Also, it reduces dependency on manual Excel reporting and helps teams access updated numbers without repeated follow-ups.
Business Intelligence Dashboards
- Power BI dashboards
- Sales and revenue reports
- Marketing performance dashboards
- Finance and profitability dashboards
- Operations and productivity dashboards
Power BI Adoption Insight
Microsoft previously reported that Power BI helped more than 250,000 organizations, including 97% of Fortune 500 companies, drive a data culture. This supports the strong enterprise adoption of BI dashboard platforms.
Source: Microsoft Power BI Blog
BI dashboards are often selected by companies that need faster performance visibility across departments. They also help teams reduce reporting delays and improve executive review meetings.
Data Engineering and Integration
- Data pipelines
- Cloud warehouse setup
- API integrations
- ETL workflows
- Data quality checks
- Centralized reporting architecture
Although this requires a higher budget, it creates the foundation for scalable analytics. Therefore, companies planning AI, predictive analytics, or real-time reporting should treat data engineering as a core investment.
Predictive Analytics and AI
- Demand forecasting
- Customer churn prediction
- Inventory optimization
- Sales forecasting
- Fraud or anomaly detection
- Pricing intelligence
However, predictive analytics works best when the business already has clean and reliable historical data. If the data foundation is weak, the first phase should focus on cleaning, integration, and governance.
Turn Your Retail Data Into Predictable Sales Growth and Better Customer Experiences Starting Today.
How to Calculate ROI from Data Analytics Services
Data analytics ROI should be calculated before the project begins. Otherwise, the team may focus only on dashboard delivery instead of business results. A clear ROI model helps leadership understand why the investment matters.
ROI Calculation Checklist
- Estimate current reporting time and cost
- Identify revenue leakage or missed opportunities
- Calculate savings from automation
- Estimate margin improvement from better decisions
- Measure productivity improvement across teams
- Compare total financial gain with analytics project cos
Simple Analytics ROI Formula
Analytics ROI = (Financial Gain – Analytics Cost) / Analytics Cost
Sample ROI Calculation Example
Assume a team spends 60 hours per month preparing manual reports. If the average internal cost is $40 per hour, manual reporting costs $2,400 per month or $28,800 annually. If analytics automation reduces 70% of this effort, the estimated annual productivity saving is $20,160, before including faster decisions, fewer reporting errors, and better forecasting impact.
ROI Benchmark
Microsoft’s commissioned Forrester Consulting study reported a 366% three-year ROI for organizations using Microsoft Power BI to build stronger data-driven cultures. This should be used as a supporting BI ROI benchmark, not as a guaranteed result for every project.
Source: Microsoft / Forrester Consulting
When Should You Hire a Data Analytics Consulting Partner?
You should hire a data analytics consulting partner when internal reporting is slow, fragmented, or unreliable. Also, external expertise is valuable when your team lacks BI, data engineering, cloud, or predictive analytics skills.
Signs You Need a Data Analytics Partner
- Reports are prepared manually every week or month
- Different teams show different numbers for the same KPI
- Leadership cannot access real-time dashboards
- Data is scattered across multiple tools
- Business users depend heavily on Excel
- Existing dashboards are not trusted
- AI or predictive analytics is planned, but data is not ready
In addition, a consulting partner can help define the right roadmap. This is important because many companies start with dashboards, but later discover they need better data pipelines, governance, or KPI definitions.
Why Choose X-Byte Analytics?
X-Byte Analytics helps businesses turn scattered data into decision-ready insights. Instead of only creating dashboards, the focus should be on business outcomes, clean data, reporting accuracy, and long-term analytics scalability.
X-Byte Analytics offers data analytics consulting services that include AI, cloud, and Power BI capabilities to streamline data processes, improve data accuracy, and support confident business decisions. Explore X-Byte Analytics Data Analytics Consulting Services
X-Byte Analytics Can Support
- Data analytics consulting services
- Business intelligence services
- Power BI consulting services
- Data engineering and integration
- KPI dashboard development
- Predictive analytics solutions
- Cloud analytics implementation
- Managed analytics support
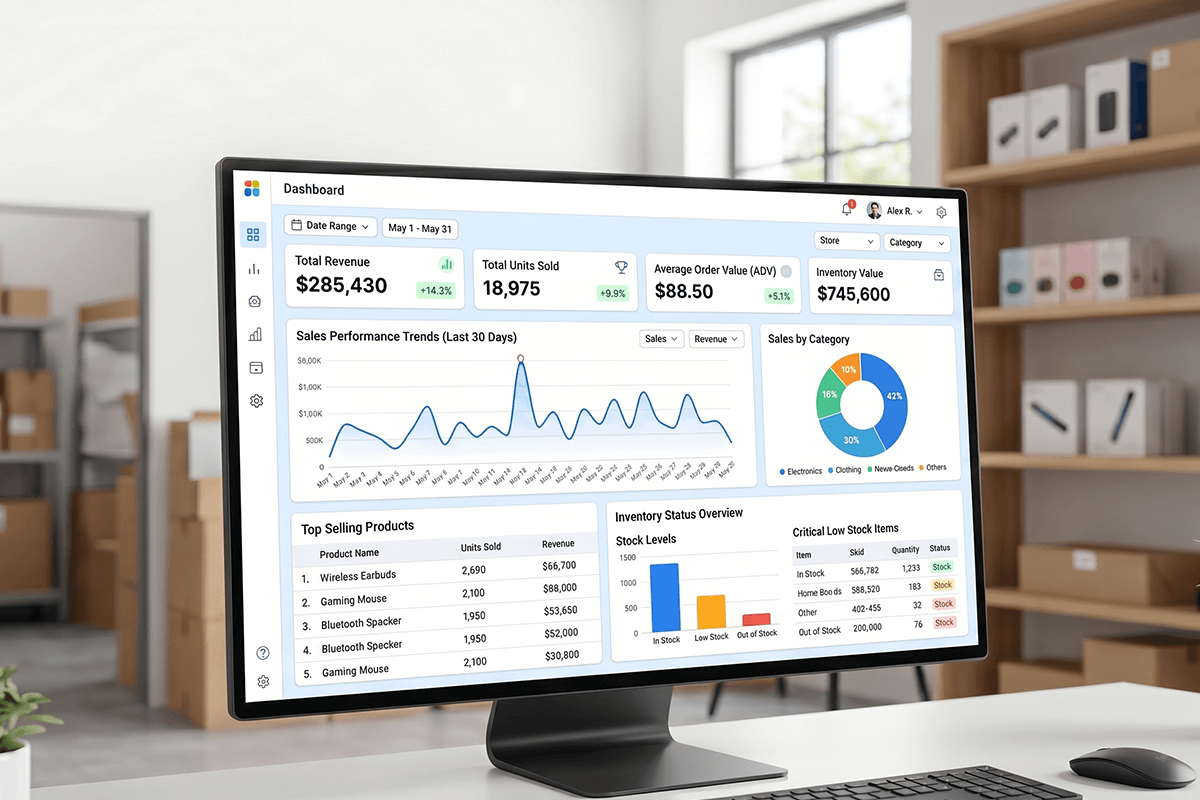
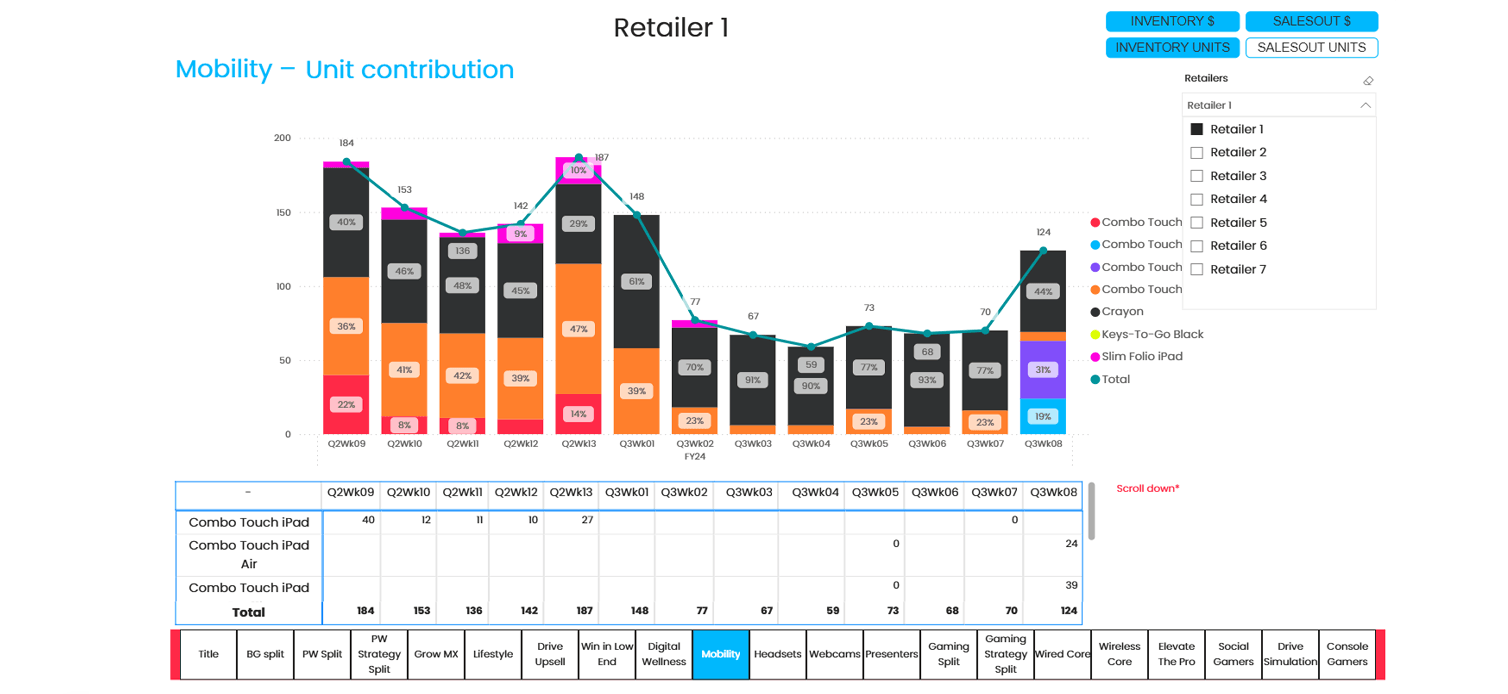
Case Study: Retail Sales & Inventory Analytics Dashboard
A U.S.-based retail and consumer electronics business needed a centralized way to review weekly sales, inventory, retailer performance, and product contribution. X-Byte Analytics developed an interactive Power BI dashboard with KPI toggles for Inventory $, SalesOut $, Inventory Units, and SalesOut Units, along with retailer filters and product-level tables.
The dashboard helped the client achieve 60% faster weekly reporting reviews, 100% centralized KPI visibility, 3X faster product contribution analysis, and improved weekly business review readiness. Read the full Retail Sales & Inventory Analytics Dashboard case study
Why Businesses Trust X-Byte Analytics
X-Byte Analytics brings 12+ years of experience in data analytics, business intelligence, AI and machine learning, data engineering, and BI visualization. With 250+ professionals and 1,500+ completed projects, the team helps startups, SMBs, and enterprises turn scattered data into decision-ready insights across 40+ industries.
Share your data sources, dashboard requirements, reporting challenges, and business goals. X-Byte Analytics can help you define the right scope, pricing model, and ROI roadmap for your business
Final Thoughts
Data analytics services cost in 2026 depends on your scope, data readiness, integrations, dashboard needs, AI goals, and support model. However, the lowest-cost option is not always the best option. A weak analytics setup can create inaccurate reports, low adoption, and poor decision-making.
Therefore, businesses should evaluate analytics pricing based on ROI, scalability, data accuracy, and long-term value. With the right consulting partner, analytics becomes more than reporting. It becomes a measurable growth system for better decisions, faster execution, and stronger business performance.
Source-Backed Statistics Used in This Guide
| Statistic | Source | Why It Matters |
|---|---|---|
| The business intelligence market is projected to grow from $37.96B in 2026 to $72.21B by 2034. | Fortune Business Insights | Shows that BI and analytics adoption is growing globally. |
| BI, big data, and analytics consultants commonly range around $25-$49/hour on Clutch. | Clutch | Gives buyers a real pricing benchmark for analytics services. |
| Big data consulting rates may average $200-$350/hour in 2026; in-house data scientist salaries may range from $54K-$140K/year. | WebFX | Supports the pricing model and in-house comparison section. |
| Analytics and BI platforms integrate data from databases, spreadsheets, cloud services, and external data feeds. | Gartner | Supports the need for proper integration andscopeplanning. |
| Power BI has helped more than 250,000 organizations, including 97% of Fortune 500 companies. | Microsoft Power BI Blog | Builds trust around enterprise BI dashboard adoption. |
| Microsoft’s commissioned Forrester study reported 366%three-year ROI for Power BI users. | Microsoft / Forrester Consulting | Strengthens the ROI argument for analytics investment. |
| Retail dashboard case study results include 60% faster weekly reporting reviews, 100% centralized KPI visibility, and 3X faster product contribution analysis. | X-Byte Analytics Case Study | Adds first-party proof and practical project experience. |