Quick Summary
- A business-focused overview of executive dashboards, explaining dashboard types, KPI tracking, and how leadership teams use real-time insights to support data-driven decisions.
- Clear insights into dashboard design, visualization frameworks, and KPI selection that help businesses build scalable, user-centric executive dashboards.
- Practical examples showing how modern BI dashboards simplify analysis, improve decision-making speed, and deliver measurable business impact.
In today’s fast-paced business environment, executives don’t struggle with a lack of data, they struggle with making sense of it quickly. This is where executive dashboard examples play a critical role. Instead of relying on spreadsheets or static reports, leaders use real-time dashboards to monitor performance, identify risks, and make confident, data-driven decisions.
An executive reporting dashboard consolidates key business metrics into a single, easy-to-understand view. From revenue and financial health to operations and strategic execution, these dashboards provide instant visibility into what is working, what needs attention, and where action is required. As organizations scale, manual reporting becomes inefficient, making executive dashboard reporting essential for timely and accurate decision-making.
This blog presents the top 10 executive dashboard examples for businesses, showcasing practical company dashboard examples used across leadership roles. It covers CEO dashboard examples, functional dashboards, and executive project dashboards while highlighting executive dashboard best practices that drive measurable outcomes. By understanding how the right corporate dashboard solution supports leadership decisions, businesses can improve visibility, alignment, and strategic execution across the organization.
What is an Executive Dashboard?
An executive dashboard is a high-level business intelligence interface designed to give senior leaders instant visibility into organizational performance. It consolidates critical business data into a single, easy-to-understand view, enabling executives to monitor KPIs, track progress toward goals, and make fast, confident decisions without relying on complex reports or spreadsheets.
Key elements of an executive dashboard include:
- Strategic KPIs and metrics focused on revenue, profitability, growth, risk, and performance
- Real-time or near-real-time data updates for timely decision-making
- Visual reporting formats such as charts, graphs, and comparisons for quick insight absorption
- Interactive drill-down capabilities to explore details when deeper analysis is required
- Custom views by role such as CEO dashboards, CFO dashboards, or executive project dashboards
Unlike operational dashboards, executive dashboard reporting emphasizes outcomes over activities. It answers high-level questions like “Are we on track?”, “Where are risks emerging?”, and “Which areas need immediate attention?” rather than focusing on daily tasks.
When built using proven executive dashboard best practices, these dashboards become a single source of truth for leadership. They reduce reporting effort, improve alignment across teams, and empower executives with clarity, turning data into strategic action rather than static information.
How to Build an Executive Dashboard?
Building an effective executive dashboard starts with understanding what decision-makers need to see, not with charts or tools. A high-performing executive reporting dashboard is designed around business goals, leadership priorities, and measurable outcomes. When done right, it delivers instant clarity and supports faster, more confident decisions.
Key steps to build an executive dashboard:
- Align with Executive Goals: Identify what leadership needs to monitor, growth, profitability, risk, efficiency, or strategic execution. Each executive dashboard should answer specific business questions.
- Define the Right KPIs and Metrics: Select a focused set of KPIs that reflect performance, not vanity metrics. Clear definitions ensure consistency across executive reporting dashboards.
- Choose the Appropriate Dashboard Type: Decide whether the dashboard is for a CEO, finance leader, sales head, or project owner. Each role requires a different level of detail and perspective.
- Select the Right BI Tools and Data Sources: Integrate data from ERP, CRM, finance systems, and marketing platforms into a unified view using reliable BI tools.
- Design for Clarity and Usability: Apply executive dashboard best practices to clean layouts, intuitive visuals, and minimal clutter to ensure insights are easy to interpret.
- Test, Deploy, and Iterate: Validate accuracy, performance, and usability. Executive dashboards should evolve as business priorities change.
A well-built executive dashboard is not a one-time report; it’s a living decision-support system. When dashboards are aligned with leadership objectives and designed for action, they become a critical asset for driving performance, accountability, and strategic execution across the organization.
Elevate Your Business Strategy Using X-Byte Analytics’ Executive Dashboard Expertise To Achieve Greater Success.
Executive Dashboard Examples for Business Leaders
Choosing the right executive dashboard depends on who is using it and what decisions they need to make. Different leadership roles require different views of data, while a CEO focuses on overall business health, a CFO prioritizes financial stability, and a sales leader tracks revenue performance. Well-designed executive dashboard examples demonstrate how the right KPIs, visuals, and reporting structure can turn complex data into immediate, actionable insight.
Below are the most commonly used executive dashboard examples across businesses:
- CEO dashboards for enterprise-wide performance visibility
- Financial dashboards for revenue, cost, and profitability tracking
- Marketing dashboards for campaign performance and ROI analysis
- HR dashboards for workforce metrics and retention insights
- Sales dashboards to monitor pipeline, targets, and conversions
- SEO dashboards to monitor organic traffic, keyword rankings, and backlinks
- Strategy dashboards for long-term goal and KPI alignment
- Operations dashboards to track efficiency, productivity, and delivery
- Manufacturing dashboards to track production output, equipment performance, quality metrics, and downtime
- Banking dashboards to measure financial performance, manage risk, and analyze customer transactions
Each of these company dashboard examples serves a specific purpose but follows the same principle: clarity over complexity. The most effective executive reporting dashboards focus only on what leaders need to see to act quickly and decisively.
In the sections that follow, we break down the top executive dashboard examples used by modern organizations, explaining what metrics they include, when to use them, and how they support smarter executive decision-making.
1. CEO Dashboards
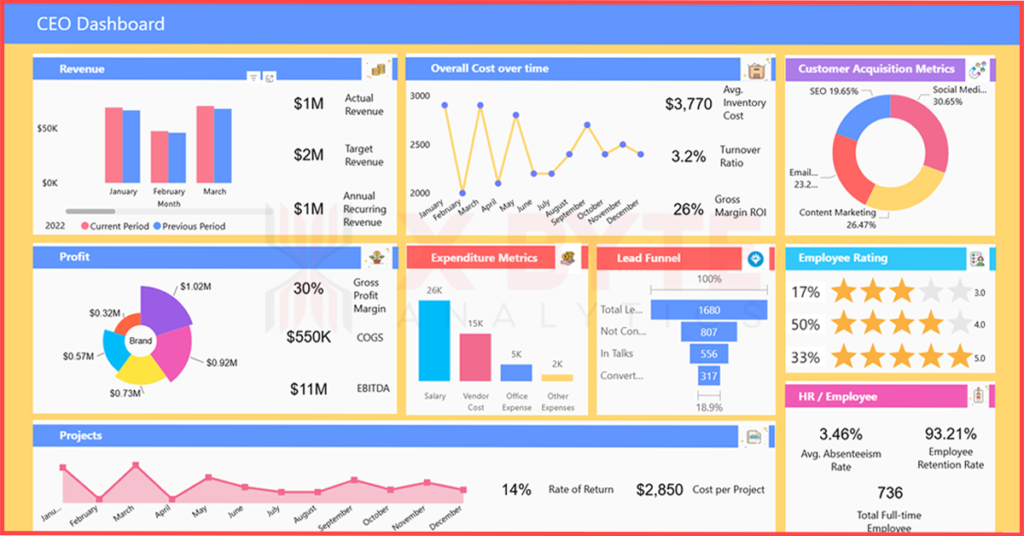
CEO dashboards provide a consolidated, real-time view of the entire organization. These dashboards are designed for strategic oversight, helping CEOs understand overall business performance, identify risks, and track progress toward company-wide goals without getting lost in operational detail.
A well-designed CEO dashboard brings together data from multiple departments into a single executive reporting dashboard, allowing leadership to assess performance at a glance and drill down only when necessary.
Key metrics commonly included in CEO dashboard examples:
- Revenue, profitability, and growth trends
- Department-wise performance summaries
- Cash flow and expense overview
- Customer acquisition and retention indicators
- Operational efficiency and risk signals
- Progress against strategic initiatives and OKRs
Unlike departmental dashboards, CEO dashboard reporting emphasizes outcomes over activities. Visuals are intentionally simple trend lines, high-level comparisons, and performance indicators, so decisions can be made quickly during board meetings, leadership reviews, or leadership check-ins.
2. Finance Dashboards
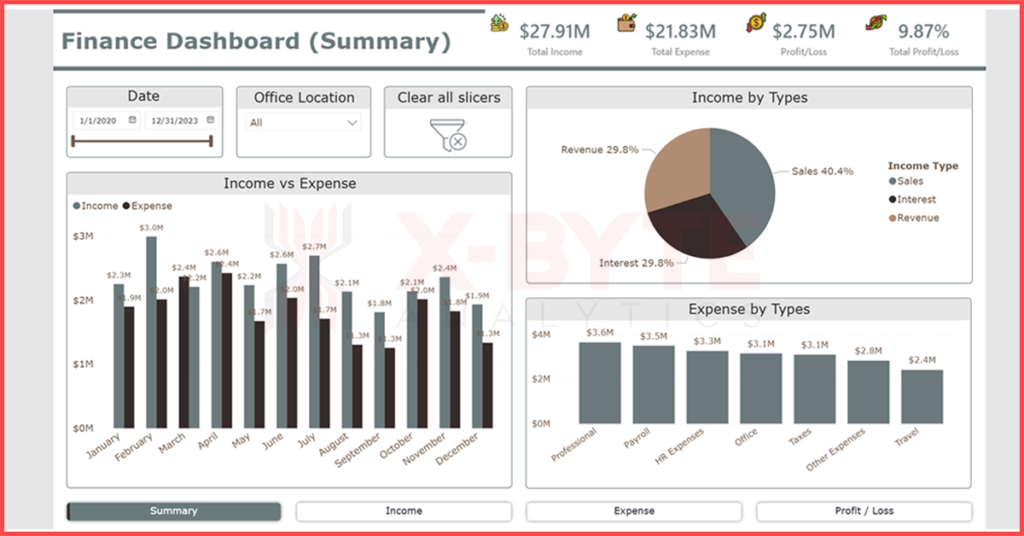
Finance dashboards give leadership a clear, real-time view of the company’s financial health. These executive reporting dashboards are built to support fast, accurate decision-making around budgeting, forecasting, cash management, and profitability without relying on static spreadsheets or delayed reports.
A strong finance dashboard example consolidates financial data from multiple systems into a single source of truth, enabling executives and finance leaders to monitor performance, identify risks early, and act with confidence.
Key metrics typically included in finance dashboard reporting:
- Revenue, expenses, and profit margins
- Cash flow and liquidity position
- Budget vs. actual performance
- Forecasts and variance analysis
- Cost center and department-wise spending
- Financial risk and compliance indicators
Instead of focusing on operational activity, finance dashboards prioritize accuracy, consistency, and drill-down capability. Executives can move from high-level financial summaries to detailed transaction-level insights, making these dashboards essential for board reporting, audits, financial planning, and strategic investment decisions.
X-Byte Analytics Helps You Harness The Power Of Executive Dashboard To Grow And Optimize Operations.
3. Marketing Dashboards
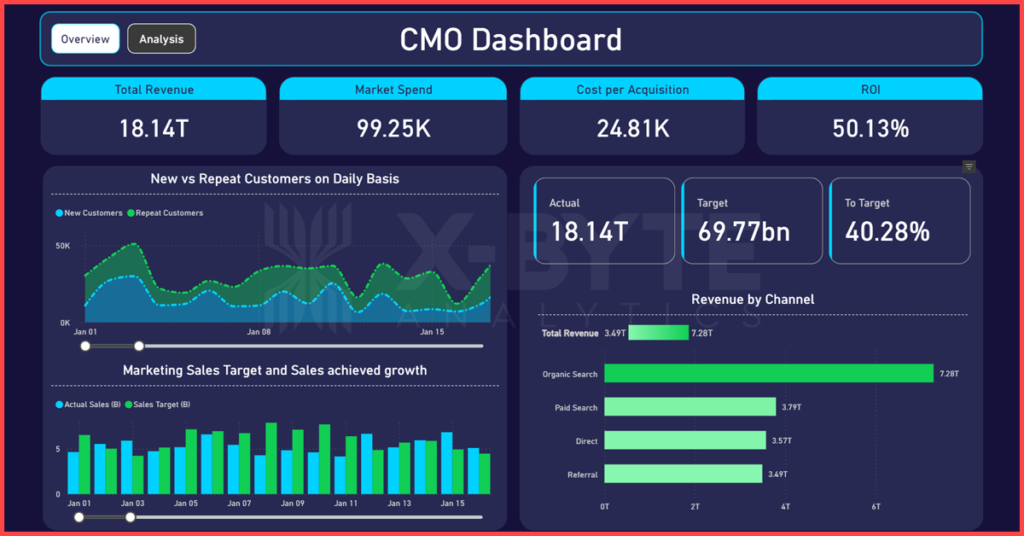
A marketing dashboard is a performance-driven executive reporting tool designed to show how effectively marketing investments convert into pipeline, revenue, and growth. For decision-makers, it answers one critical question: Which marketing activities are driving results and which are wasting budget? A well-built marketing dashboard replaces fragmented channel reports with a single, revenue-aligned view of marketing performance.
Key metrics typically included in a Marketing Dashboard:
- Lead volume and lead quality (MQLs, SQLs)
- Conversion rates across funnel stages
- Campaign performance and ROI
- Customer acquisition cost (CAC)
- Channel-wise performance (paid, organic, social, email)
- Marketing spend vs. revenue contribution
- Pipeline and revenue attribution
Marketing dashboards are most effective when they connect top-of-funnel activity directly to sales outcomes. Instead of isolated vanity metrics, executives get visibility into how campaigns impact pipeline velocity, deal conversion, and customer acquisition efficiency. With real-time and historical views, leadership can quickly reallocate budgets, double down on high-performing channels, and pause underperforming initiatives.
When implemented correctly, a marketing dashboard becomes a decision engine not just a reporting layer. It empowers CMOs, growth leaders, and executives to optimize spend, improve ROI, and scale predictable growth using data-backed insights rather than assumptions.
4. HR Dashboard
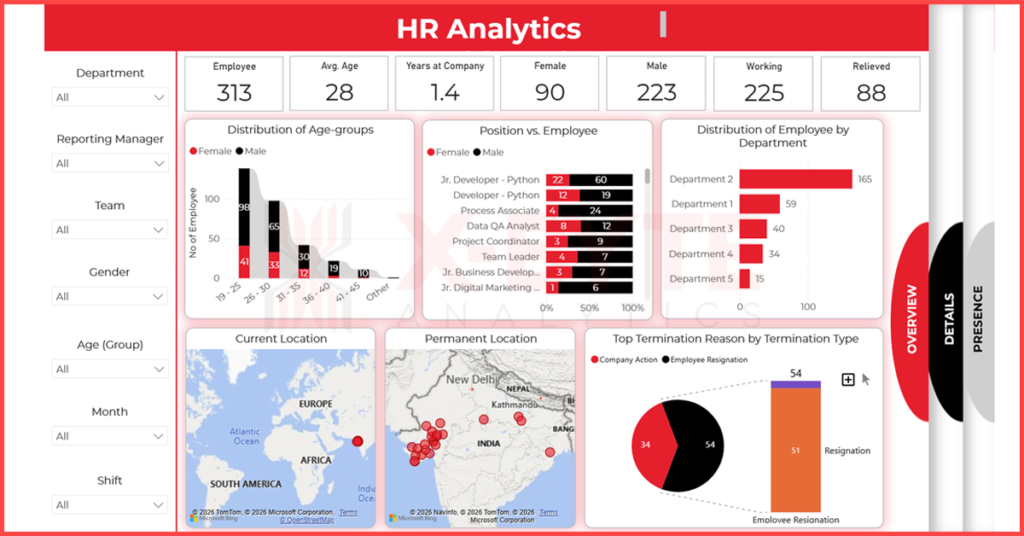
An HR dashboard is an executive-level reporting solution that provides leadership with clear visibility into workforce performance, talent health, and people-related costs. It helps decision-makers understand whether the organization has the right people, in the right roles, at the right cost, while supporting business growth and operational stability.
Key metrics typically included in an HR Dashboard:
- Employee headcount and workforce distribution
- Hiring pipeline and time-to-hire
- Attrition and retention rates
- Employee performance and productivity indicators
- Training, upskilling, and engagement metrics
- Compensation, benefits, and people-related costs
HR dashboards enable executives to move from reactive workforce management to proactive talent planning. Instead of relying on static HR reports, leaders gain real-time insights into hiring gaps, attrition risks, and workforce efficiency. This allows faster intervention, better resource planning, and stronger alignment between people strategy and business goals.
5. Sales Dashboard
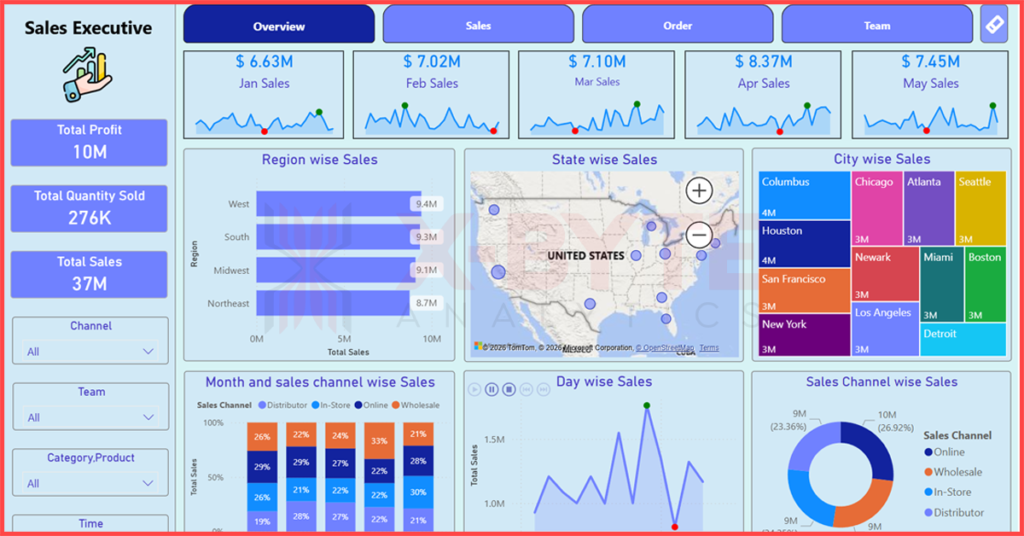
A sales dashboard is an executive reporting tool designed to give leadership a clear, real-time view of revenue performance, pipeline health, and sales execution. It consolidates critical sales data into a single, decision-ready interface so executives can quickly assess whether revenue targets are on track and where corrective action is needed.
Key metrics typically included in a Sales Dashboard:
- Total revenue and revenue growth trends
- Sales pipeline value and stage-wise conversion rates
- Lead generation and qualification performance
- Win/loss ratios and deal velocity
- Individual and team-level sales performance
- Forecast vs. target analysis
Sales dashboards eliminate guesswork from revenue planning. Instead of reviewing disconnected CRM reports or spreadsheets, executives gain instant visibility into sales bottlenecks, underperforming segments, and high-impact opportunities. This enables faster decision-making around pricing, territory allocation, sales strategy, and resource deployment.
When built for executive use, a sales dashboard becomes a revenue acceleration tool. It aligns sales teams with business goals, improves forecast accuracy, and empowers leadership to drive consistent growth through data-backed sales decisions.
6. SEO Dashboard
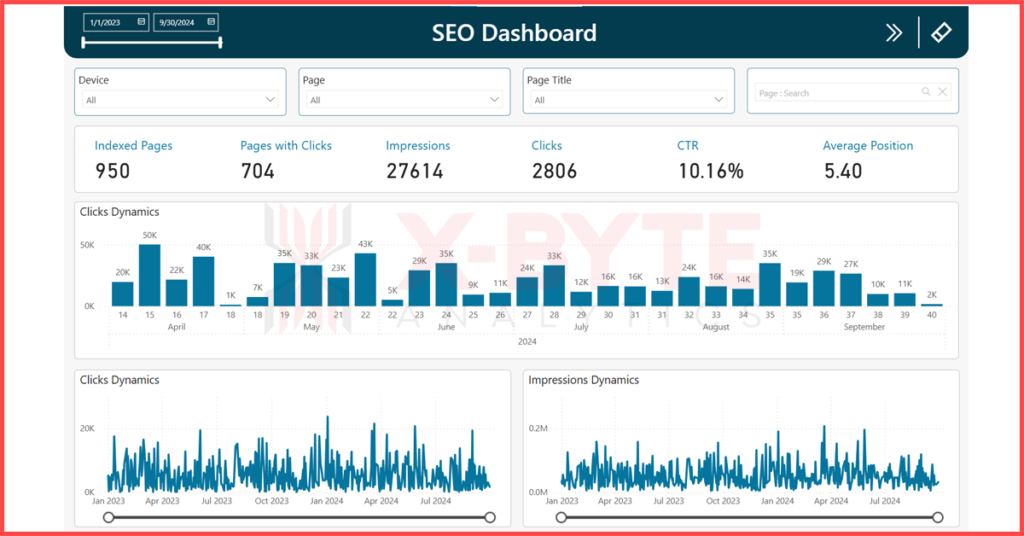
An SEO dashboard provides executives and marketing leaders with a clear view of organic performance and search-driven growth. It translates complex SEO data into measurable business outcomes, helping decision-makers understand how search visibility contributes to traffic, leads, and revenue.
Key metrics typically included in an SEO Dashboard:
- Organic traffic trends and growth rate
- Keyword rankings and visibility changes
- Click-through rate (CTR) and impressions
- Conversion rate from organic traffic
- Backlink profile and domain authority
- Technical SEO health and site audit scores
An executive-focused SEO dashboard connects marketing efforts directly to results. Instead of relying on fragmented reports from multiple tools, leaders can quickly evaluate what’s driving organic growth, where rankings are slipping, and which optimizations deliver the highest ROI.
By presenting SEO insights in a structured, business-first format, the dashboard supports confident budget allocation and long-term digital strategy. It ensures organic search performance is monitored as a revenue-driving channel, not just a marketing activity.
7. Strategy Dashboard
A strategy dashboard provides executives with a clear, high-level view of how the organization is progressing against its long-term objectives. It focuses on outcomes rather than day-to-day activities, helping leadership teams evaluate whether strategic initiatives are delivering measurable business value.
Key metrics typically included in a Strategy Dashboard:
- Strategic goal progress and milestone tracking
- Revenue growth and cost performance against targets
- Year-over-year and quarter-over-quarter comparisons
- Market expansion and competitive positioning indicators
- Risk exposure and mitigation status
- Alignment between initiatives and business objectives
By centralizing strategic KPIs, a strategy dashboard enables leaders to assess performance gaps, recalibrate priorities, and allocate resources more effectively. It ensures that decisions are driven by data aligned with the company’s vision and growth plans.
With consistent visibility into strategic performance, executives gain confidence in steering the organization toward sustainable growth while maintaining alignment across departments and leadership teams.
8. Operations Management Dashboard
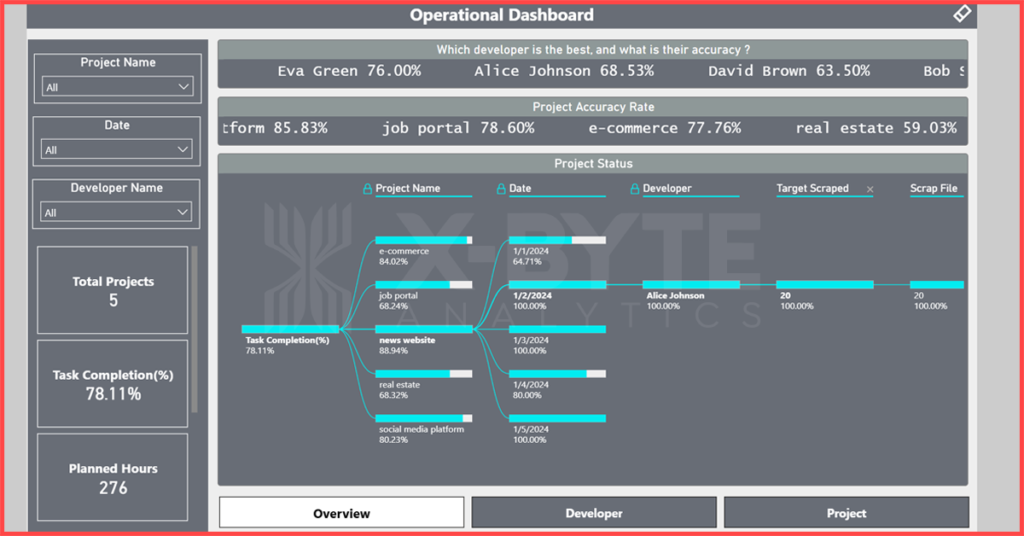
An operations management dashboard gives executives real-time visibility into how efficiently the organization is running. It consolidates operational data across departments into a single, actionable view, enabling leaders to quickly identify bottlenecks, inefficiencies, and risks that could impact performance.
Key metrics commonly tracked in an Operations Management Dashboard:
- Process and workflow performance
- Task and project completion status
- Resource utilization and capacity planning
- Department-wise productivity and output
- Operational costs and budget adherence
- SLA compliance and turnaround times
By monitoring operational KPIs in one place, executives can proactively address issues, improve cross-functional coordination, and optimize processes before they affect business outcomes. This dashboard supports faster interventions and more controlled execution.
A well-designed operations management dashboard empowers leadership to maintain operational stability, improve efficiency at scale, and ensure day-to-day execution stays aligned with strategic objectives.
9. Banking Dashboard
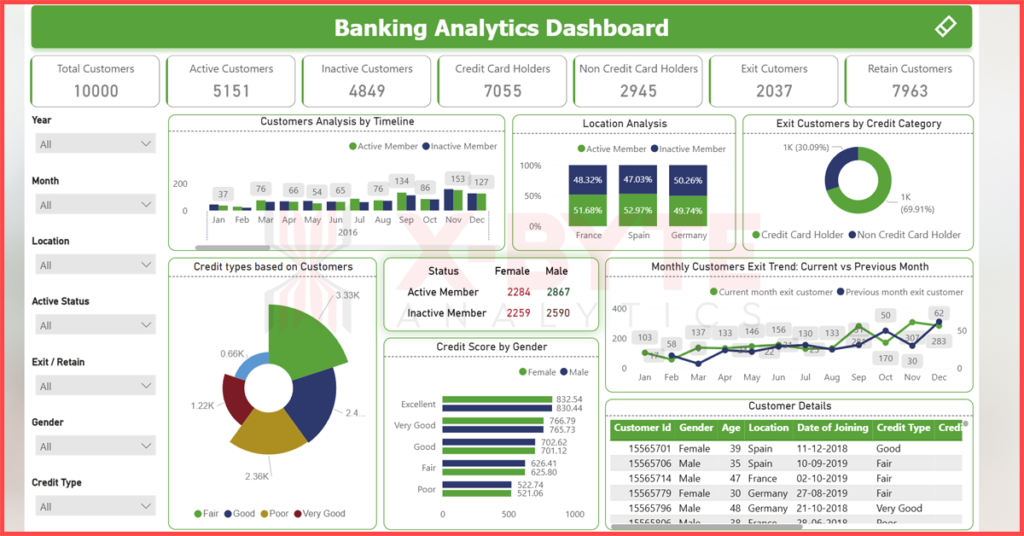
A banking dashboard provides executives and leadership teams with a real-time, consolidated view of financial performance, risk exposure, and customer activity across the organization. Designed for fast, high-stakes decision-making, this executive reporting dashboard transforms complex banking data into clear, actionable insights that support regulatory compliance, profitability, and operational stability.
Key metrics typically included in a banking dashboard:
- Net interest margin and overall revenue performance
- Loan portfolio health and credit risk indicators
- Non-performing assets (NPA) and delinquency ratios
- Customer deposits, withdrawals, and liquidity position
- Fraud detection alerts and transaction anomalies
- Regulatory and compliance reporting metrics
By visualizing these KPIs in one centralized platform, banking leaders can monitor trends, identify risks early, and respond quickly to market or regulatory changes. A well-structured banking dashboard also improves transparency across departments, ensuring finance, risk, and operations teams work from a single source of truth.
10. Manufacturing Dashboard
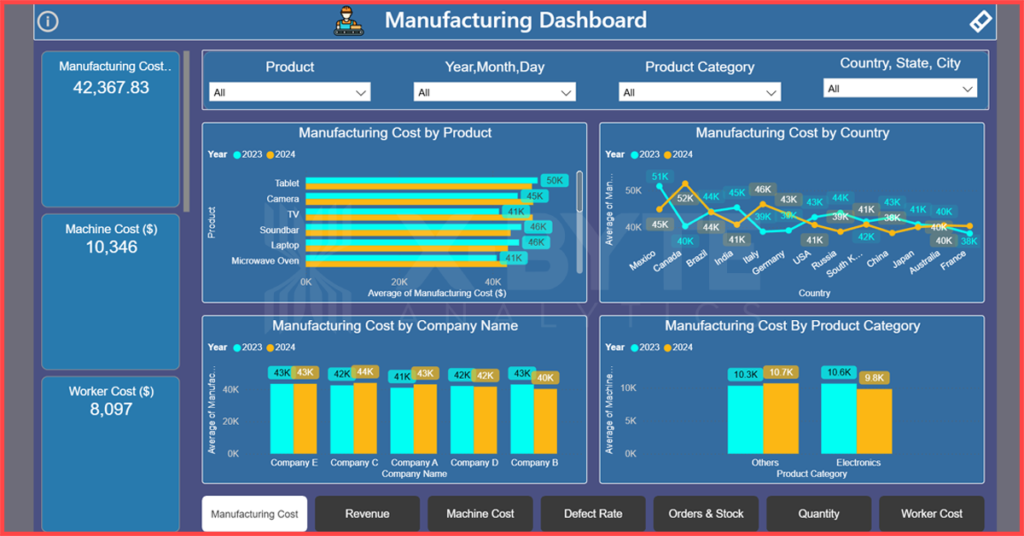
A manufacturing dashboard provides real-time visibility into production performance, operational efficiency, and quality metrics, enabling leadership teams to identify issues early and optimize output. Built for plant managers, operations heads, and executives, this dashboard consolidates data from machines, ERP systems, and supply chain tools into a single, decision-ready view.
Key metrics typically tracked in a manufacturing dashboard include:
- Overall Equipment Effectiveness (OEE)
- Production volume vs. targets
- Downtime and root-cause analysis
- Defect rates and quality yield
- Inventory levels and material utilization
- Maintenance schedules and asset performance
With these insights, decision-makers can quickly detect bottlenecks, reduce unplanned downtime, and improve throughput without relying on manual reports. A well-designed manufacturing dashboard supports lean operations, predictive maintenance, and continuous improvement initiatives across the production lifecycle.
By implementing a manufacturing dashboard aligned with executive dashboard best practices, organizations gain tighter control over operations, improved cost efficiency, and faster response to operational risks, turning manufacturing data into a competitive advantage.
Benefits of Executive Dashboards
Executive dashboards deliver immediate business value by transforming complex data into clear, decision-ready insights for leadership teams. Instead of relying on static reports or fragmented data sources, executives gain a real-time, centralized view of organizational performance aligned with strategic goals.
Key benefits of executive dashboards include:
- Clear performance visibility: Instantly track KPIs across finance, sales, operations, and growth functions
- Faster decision-making: Access real-time insights without waiting for manual reports
- Improved accountability: Align teams around shared metrics and measurable outcomes
- Time efficiency: Eliminate manual data collection and repetitive reporting tasks
- Consistent reporting: Ensure standardized metrics and definitions across the organization
- Scalable insights: Support growth with dashboards that adapt as data volumes and business complexity increase
By consolidating critical metrics into a single, executive-ready interface, dashboards enable leaders to focus on actions rather than analysis. This clarity drives smarter decisions, stronger alignment, and sustained business performance at scale.
Explore the best executive dashboards to drive your business success
Conclusion
Executive dashboards are no longer a reporting add-on; they are a critical decision-support system for modern businesses. By centralizing KPIs, automating reporting, and delivering real-time visibility, executive dashboards empower leadership teams to act faster, stay aligned, and drive measurable outcomes.
When designed around business objectives, user roles, and executive dashboard best practices, these dashboards move beyond visuals to become strategic tools. Organizations that invest in the right executive reporting dashboard gain clarity across operations, stronger accountability, and a scalable foundation for data-driven growth.
Ready to turn your data into executive-ready insights? Partner with X-Byte Analytics to build custom executive dashboards and power BI consulting services that align with your strategy, scale with your business, and deliver decisions you can act on fast.