

Key Highlights:
This guide helps leaders and BI teams understand the complete journey of migrating from Tableau to Power BI. In this blog, you’ll learn:
- The full step-by-step Tableau to Power BI migration process explained in a simple, structured manner.
- Cost, timeline, and ROI models that help estimate value and justify the business case.
- Challenges, best practices, and governance considerations to ensure fast and successful Power BI adoption in 2025.
Introduction
Business intelligence platforms are evolving rapidly. With the rise of AI-driven analytics, Microsoft Fabric, and unified data governance, organizations are rethinking their BI investments. This is why Tableau to Power BI migration has become a strategic priority for CIOs, CTOs, BI Directors, and data-led enterprises in 2025.
Power BI offers a more cost-efficient, scalable, and integrated analytics environment—especially for companies already operating within the Microsoft ecosystem. This blog provides a complete roadmap: from migration steps to the cost of Tableau to Power BI migration, business timelines, ROI, and best practices that help ensure a smooth transition.
Why Companies Are Moving from Tableau to Power BI in 2025
Organizations are increasingly prioritizing analytics platforms that offer:
- Better pricing
- Easier governance
- Native integrations
- Strong AI capabilities
- Improved collaboration
These trends make Power BI an attractive long-term BI investment.
1. Massive Cost Savings
Most enterprises switch to Power BI for its significantly lower licensing and maintenance costs. Tableau’s role-based pricing becomes expensive at scale, especially for companies with hundreds of users. Power BI typically reduces total BI spend by 40–70%, making migration financially compelling.
2. Microsoft Ecosystem Advantage
A major driver behind Tableau vs Power BI migration decisions is ecosystem compatibility. Power BI integrates deeply with Microsoft 365, Azure, OneLake, Teams, Dynamics, and now Microsoft Fabric.
For companies already relying on Microsoft tools, Power BI becomes a natural extension—enhancing collaboration, governance, and user adoption.
3. AI, Automation & Fabric Capabilities
Power BI has taken a leap forward with:
- Copilot for BI
- Direct Lake mode
- AI-powered visual generation
- Unified Fabric analytics experience
- Automated data lineage & governance
This makes Power BI more future-ready and automation-driven than traditional visualization tools.
4. Unified Governance & Enterprise Scalability
Power BI’s governance layer includes:
- Row-level security
- Object-level security
- Workspace roles
- Data lineage
- Usage analytics
For enterprises with large BI ecosystems, this unified governance model is easier to scale than Tableau’s distributed approach.
Tableau vs Power BI
Evaluating Tableau vs Power BI migration helps organizations understand long-term benefits before shifting platforms. Power BI’s strengths in cost, ecosystem integration, AI, and governance make it highly appealing for companies seeking modernization.
Power BI also aligns naturally with enterprise technology stacks that already include Azure or Microsoft 365. This lowers total cost of ownership and simplifies daily reporting workflows. Tableau remains strong in visualization depth, but its fragmented ecosystem and higher pricing limit long-term scalability.
Comparison Table
| Feature | Tableau | Power BI |
| Licensing | Higher & granular | Affordable & simple |
| Ecosystem Integration | Limited | Deep Microsoft integration |
| AI & Automation | Moderate | Advanced + Fabric + Copilot |
| Data Modeling | Worksheet-level logic | Centralized semantic models |
| Governance | Good | Enterprise grade |
| Visualization | Strong | Strong + AI enhancements |
Step-by-Step Tableau to Power BI Migration Process
A successful migration requires a structured approach that balances technical accuracy, governance, performance tuning, and user adoption. Below is a clear, enterprise-ready migration framework.
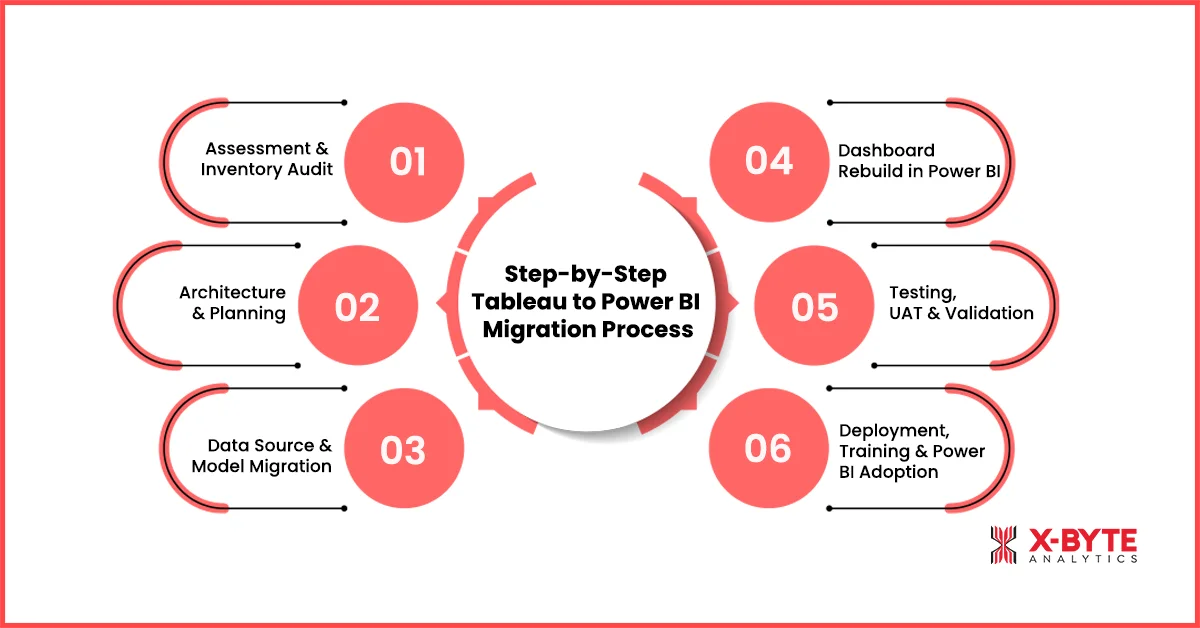
Step 1: Assessment & Inventory Audit
This is the foundation of the migration project.
Key actions:
- Catalog all Tableau dashboards, data sources, and calculations
- Identify unused or low-value dashboards
- Evaluate data extracts, LOD expressions, and custom visuals
- Assess data quality and performance issues
- Document security roles and governance dependencies
Outcome: A prioritized migration roadmap with complexity scoring to prepare for Power BI Dashboard Development.
Step 2: Architecture & Planning
Once the audit is complete, the architecture team designs the Power BI environment.
Activities include:
- Defining workspace structure and governance
- Identifying datasets to build as semantic models
- Mapping Tableau logic to Power BI’s DAX model
- Planning deployment (Pro, Premium, Fabric)
- Establishing RLS/OLS and ownership hierarchy
Outcome: A detailed migration blueprint aligned with future Power BI Executive Dashboard Examples and scalable BI governance.
Step 3: Data Source & Model Migration
Power BI requires well-modeled, optimized datasets—not a direct copy of Tableau logic.
Tasks:
- Recreate Tableau extracts using Power Query
- Build star schema-based models for efficient Power BI Dashboard Development
- Convert LOD expressions into DAX using standardized logic
- Enable incremental refresh for large datasets
- Validate data accuracy against Tableau outputs
Outcome: High-performance datasets ready for report building in Power BI.
Step 4: Dashboard Rebuild in Power BI
Dashboards are recreated—and often improved—using Power BI’s visualization and interaction features.
Activities:
- Rebuilding visuals using native and custom visuals
- Designing intuitive layouts optimized for Power BI
- Adding drill-throughs, bookmarks, tooltips, and AI visuals
- Improving UX and performance across multiple pages
- Ensuring functional parity with Tableau through guidance from Tableau Consulting Service
Outcome: User-ready dashboards that often perform better and load faster, comparable to other modern dashboard.
Step 5: Testing, UAT & Validation
Testing ensures accuracy, trust, and performance.
Includes:
- Data validation (numbers match Tableau)
- Logic/measure verification
- Load time and refresh testing
- Security testing
- End-user UAT supported by BI teams
Outcome: Approved dashboards ready for deployment.
Step 6: Deployment, Training & Power BI Adoption
Migration success requires user adoption.
Key activities:
- Workspace-based deployment aligned with governance
- Creating Power BI Apps for simplified navigation
- Role-based training sessions to increase Power BI adoption
- Continuous monitoring of usage for the first 60–90 days
- Providing hypercare support
Outcome: Smooth organizational transition supported by scalable dashboard practices.
Start Your Tableau To Power BI Migration With A Free Expert Audit Today.
Timeline for Tableau to Power BI Migration
Understanding the Power BI migration timeline 2025 allows stakeholders to plan around deployment, testing, training, and change management. No two migrations are identical—timelines depend on complexity, redesign needs, and user readiness.
Factors influencing the timeline include:
- Number of dashboards and reports
- Dataflows and data source complexity
- Volume of Tableau Prep flows
- Need for UX redesign
- Amount of UAT required
- Team size and availability
- Governance and compliance requirements
Typical Timeline Ranges
- 20–50 dashboards: 1.5 to 3 months
- 50–150 dashboards: 3 to 6 months
- 150–500 dashboards: 6 to 12 months
ROI of Tableau to Power BI Migration
Before calculating returns, it’s important to understand why ROI matters. Migration provides value beyond licensing savings—it impacts productivity, governance, automation, and decision-making across the organization.
The ROI migrating to Power BI typically comes from five major dimensions:
1. Reduced Licensing & Infrastructure Cost
Organizations immediately reduce BI spend by eliminating expensive Tableau licenses—usually saving 40% to 70% annually.
2. Improved Analyst Productivity
Centralized semantic models and faster dashboards reduce manual effort and IT dependency across teams.
3. Better Governance = Lower Risk
Standardized governance reduces compliance issues, shadow reporting, and data inconsistencies.
4. AI & Automation Boost Reporting Speed
Copilot, Fabric, and AI-enhanced modeling drastically reduce report creation time.
5. Faster & More Confident Decision-Making
With unified dashboards and advanced BI capabilities, teams get insights faster—improving agility across departments.
Common Challenges & How to Avoid Them
Migration can be complex if not approached strategically. Many organizations face issues related to LOD conversion, data modeling, governance gaps, and user training. With the right planning, these obstacles are easily manageable.
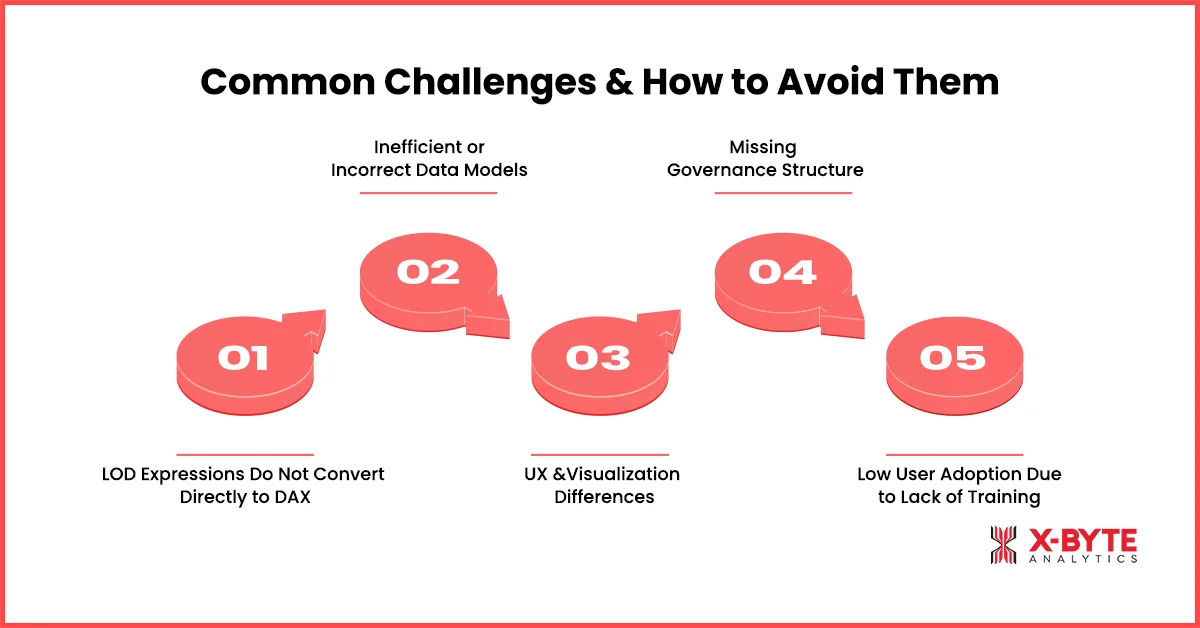
1. LOD Expressions Do Not Convert Directly to DAX
LOD logic is one of Tableau’s strongest features—Power BI handles similar logic differently.
How to avoid issues:
- Create standardized DAX templates
- Validate logic with sample datasets
- Document formulas for future reference
2. Inefficient or Incorrect Data Models
Tableau’s worksheet-level logic doesn’t translate well to Power BI.
How to avoid issues:
- Rebuild semantic models
- Follow star schema best practices
- Avoid one-to-one replication of Tableau worksheets
3. UX and Visualization Differences
Design patterns differ between the tools.
How to avoid issues:
- Redesign layouts for Power BI instead of copying Tableau
- Use Power BI-native visuals and interactions
4. Missing Governance Structure
Rushing deployment without governance leads to BI chaos.
How to avoid issues:
- Define workspace design early
- Implement RLS/OLS
- Document ownership and sharing protocols
5. Low User Adoption Due to Lack of Training
Adoption is the most overlooked step.
How to avoid issues:
- Conduct role-based training
- Create Power BI Apps for easy navigation
- Monitor usage and provide hypercare
Book A 30-Minute Power BI Migration Consultation And Unlock Faster, Cost-Efficient Analytics.
Best Practices for a Successful Migration
Migrating from Tableau to Power BI is easier and more predictable when following best practices used by leading BI consulting teams.
1. Prioritize High-Value Dashboards First
Focus on dashboards that deliver maximum impact to business teams.
2. Standardize Data Models Before Building Dashboards
A consistent semantic layer reduces rework and accelerates reporting.
3. Document Calculations, Sources & Logic
Thorough documentation simplifies maintenance and compliance.
4. Apply Governance from the Beginning
Define workspace roles, refresh strategies, RLS/OLS, and lineage early in the project.
5. Run Parallel Testing During Transition
Compare Power BI outputs with Tableau for accuracy and trust-building.
6. Invest in Training & Adoption Enablement
Train executives, analysts, and business users differently based on needs.
Conclusion
Migrating from Tableau to Power BI is not just a technical upgrade—it’s a strategic shift that shapes the future of your organization’s analytics capabilities. With rising BI licensing costs, the rapid evolution of Microsoft Fabric, and AI becoming central to the intelligence stack, Power BI offers a more cost-efficient, collaborative, and future-proof platform.
A structured migration framework—combined with strong governance, optimized data models, and the right adoption strategy—ensures that your business achieves measurable value within months. Whether your goals include lowering BI costs, unifying your analytics ecosystem, or accelerating insights across departments, a properly executed migration unlocks long-term benefits.
Partnering with experienced Power BI Consulting Services ensures your transition is smooth, risk-free, and aligned with both technical best practices and business outcomes. With the right guidance, your organization can modernize its analytics landscape and unlock the true potential of Power BI.


