Tableau Superstore Dashboard
Retail decisions move fast and the Tableau Superstore Dashboard by X-Byte Analytics helps your data keep up. This custom Tableau Superstore Dashboard brings sales, profit, inventory, and return data into one interactive Tableau view, enabling leaders to quickly spot revenue drivers, margin issues, and improvement opportunities across stores, regions, and product categories.


What Is a Tableau Superstore Dashboard?
A Tableau Superstore Dashboard is a centralized analytics tool designed to provide retail and superstore businesses with real-time insights into their performance. It integrates key data points, including sales, inventory records, product information, customer segments, and regional trends, all within a single Tableau interface.
Through our Tableau Dashboard Development Services and Tableau Analytics Consulting, this dashboard enables businesses to move away from scattered reports and manual analysis. It helps answer critical business questions, such as which products are profitable and which are not.
Additionally, it identifies areas where discounts are impacting margins and highlights the best-performing regions and customer segments. The dashboard also provides insights into how returns are affecting both revenue and inventory.
With our Tableau Consulting Service, this dashboard becomes more than just a visual tool—it transforms into a daily decision-making companion, enabling retail teams to make informed, data-driven decisions efficiently.
- DASHBOARD
Live Tableau Superstore Dashboard Experience
Our Enterprise Tableau Superstore Dashboard provides a live view of sales, inventory, profitability, and returns in one place. Designed for daily use, it lets teams quickly drill down from high-level trends to the exact product, store, or customer segment, helping them understand not just what’s happening, but why.
KPIs & Metrics Tracked
Our Tableau KPI dashboard focuses on the metrics that matter most for retail growth, cost control, and profitability without overwhelming users. It presents the right KPIs in a clear, easy-to-understand format so teams can track performance, spot issues early, and make confident decisions every day.
- Total Sales: View revenue performance across regions, categories, and time periods
- Gross Profit & Margin %: Understand real profitability after discounts and returns
- Return Rate %: Identify products or regions with high return volumes
- Discount Impact: See how pricing strategies affect margins
- Regional Performance: Measure demand and efficiency across locations
- Customer Segment Profitability: Identify high-value and low-margin customers
- Category & Sub-Category Performance: Compare contribution to sales and profit
- Inventory Turnover: Spot slow-moving or overstocked items
Core Features of the Tableau Superstore Dashboard
Our Enterprise Tableau Dashboard Solutions are powerful yet easy to use, helping teams quickly understand performance and take action with confidence.

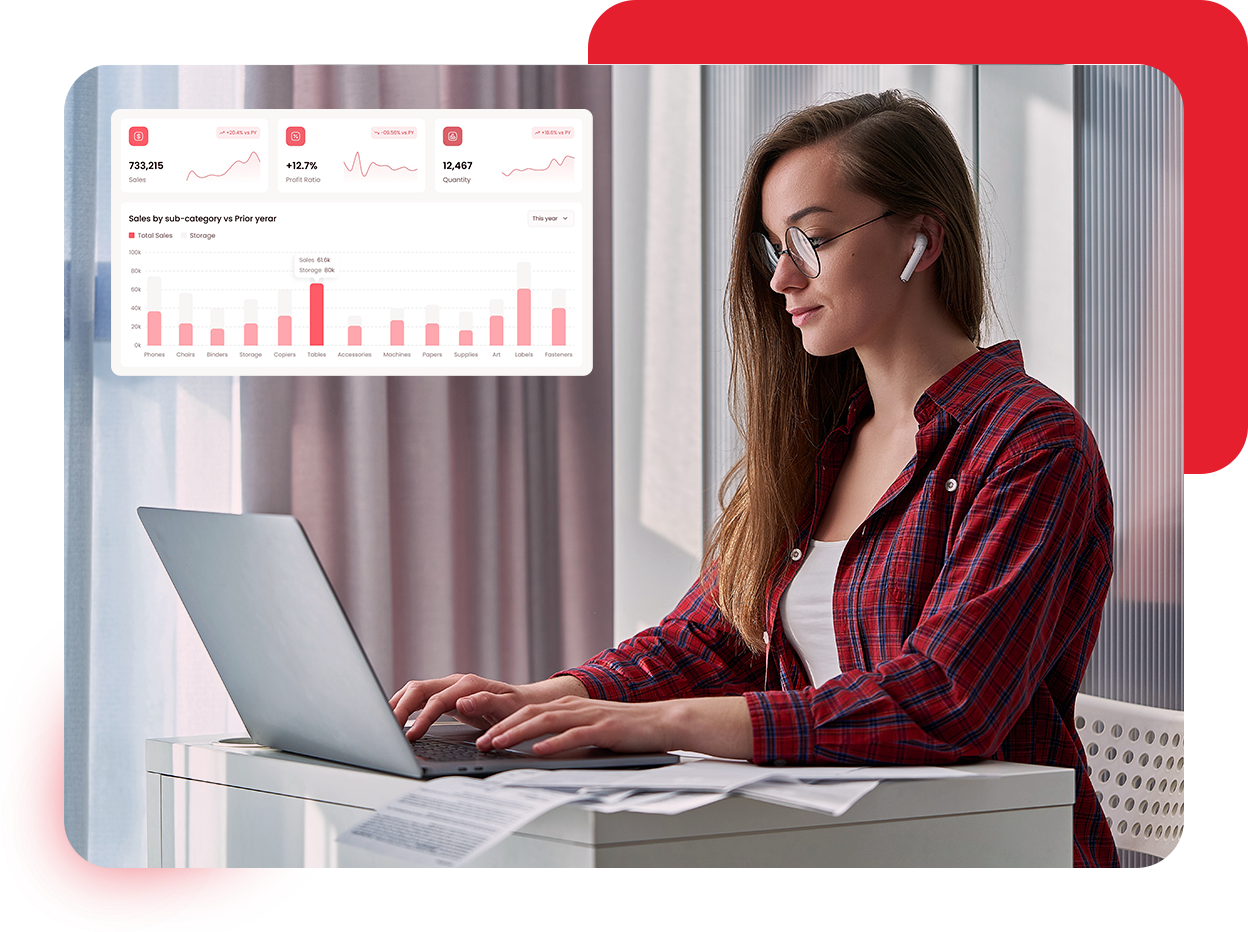
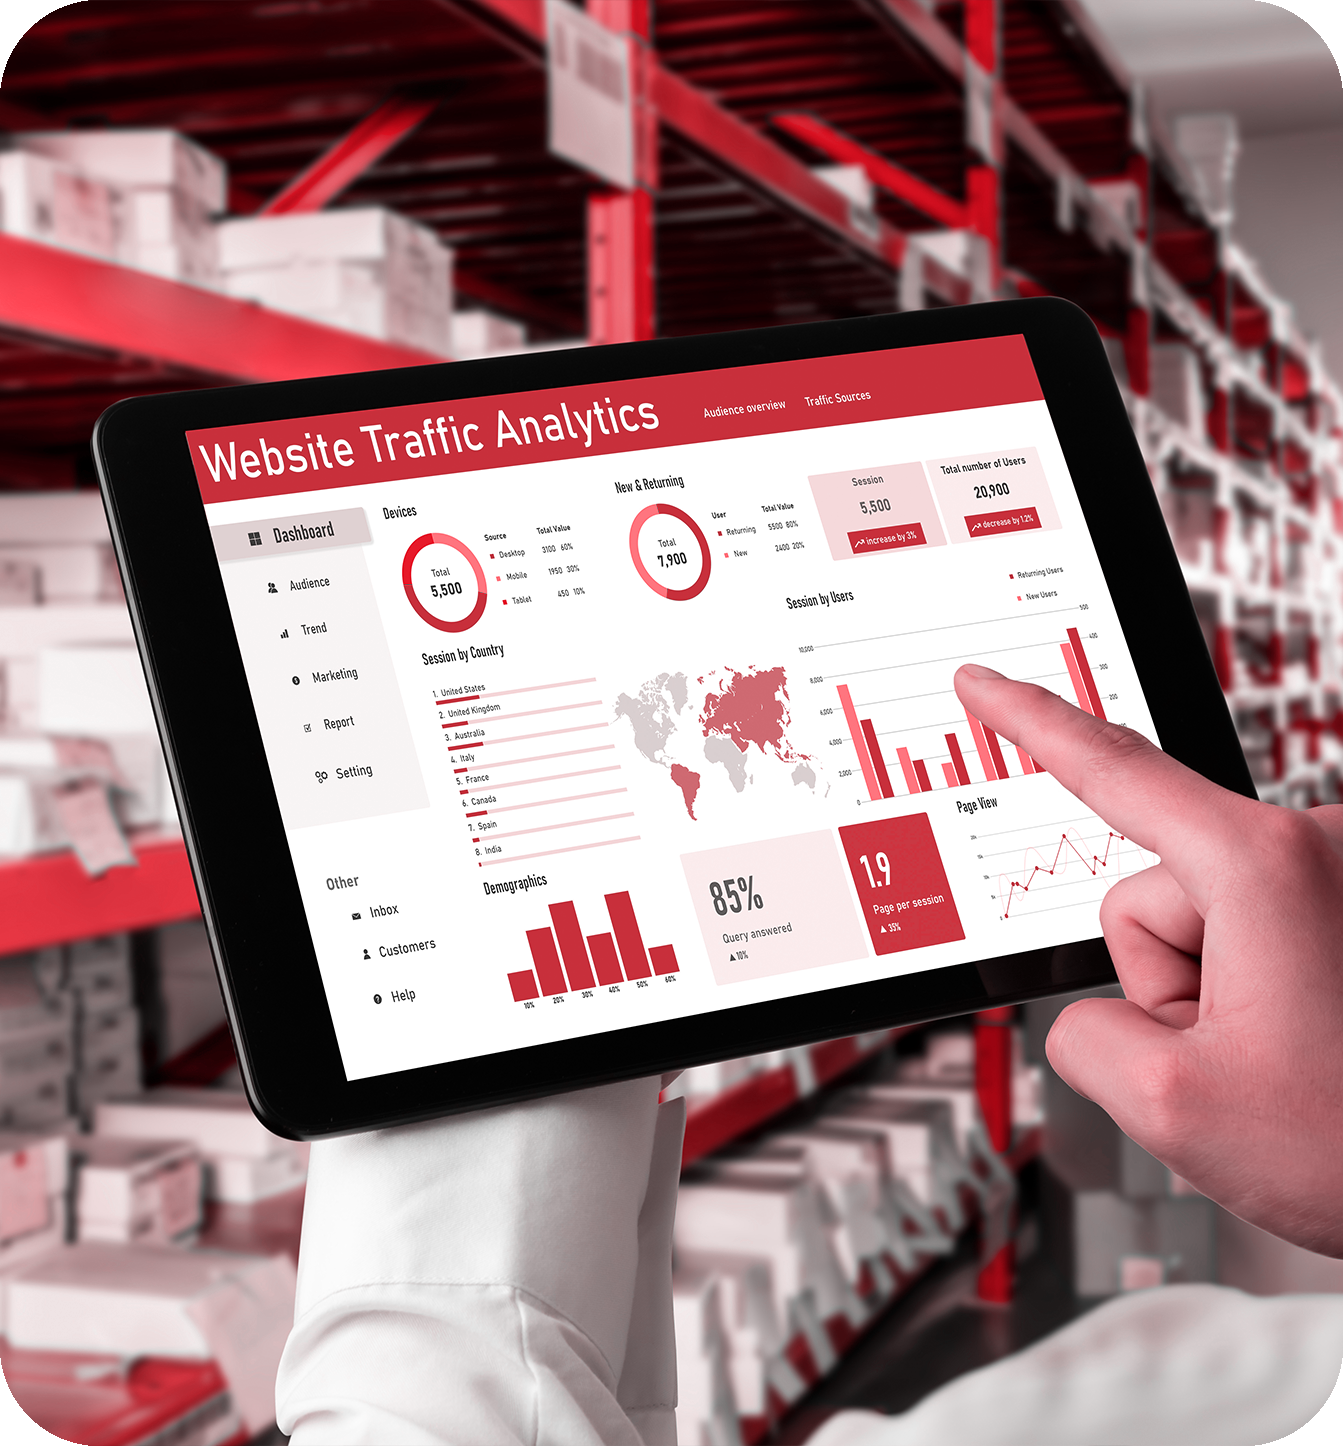
Live Performance Tracking
Easy Filters & Drill-Downs
Automated Data Updates
Issue Identification
Clear Visual Storytelling
Enterprise Security & Access Control
Who Is This Dashboard For?
The Tableau Superstore Dashboard for retail performance tracking is designed for teams that need clear visibility into sales, inventory, profitability, and returns—without waiting on manual reports. It supports faster decisions, better coordination across teams, and greater confidence at every level of retail operations.
- Retail & Superstore Leadership
- Category & Merchandise Managers
- Business Intelligence Teams
- Ecommerce & Omnichannel Managers
- Inventory & Operations Planners
- Store Operations & Regional Managers
- Sales Heads & Commercial Teams
- Finance & FP&A Teams
Unlock Your Tableau Superstore Dashboard
Bring clarity to your retail data with a custom Tableau Superstore Dashboard designed around your business goals—not templates.
Why Retailers Use Superstore Dashboard?
Retail operations today deal with large data volumes, tight margins, and constant demand shifts. An interactive Tableau dashboard for inventory, sales, and returns helps organizations stay in control instead of reacting late.
- Combines sales, inventory, and finance data into one view
- Highlights margin risks before they grow
- Improves demand planning and stock decisions
- Simplifies leadership reporting
- Supports growth across multiple stores and regions
- Improves response time to sales and pricing changes

Key Benefits of the Tableau Superstore Dashboard
This retail analytics dashboard in Tableau helps retailers turn everyday operational data into clear, actionable insights. By bringing sales, inventory, returns, and profitability together in one view, it enables teams to make smarter decisions, control margins, and scale operations with confidence.
Complete Retail Visibility
Get a unified view of sales performance, inventory movement, returns, and profit across all stores and regions from a single dashboard.
Better Margin Control
Quickly identify loss-making products, high discount impact, and return-heavy SKUs before they affect overall profitability.
Smarter Inventory Planning
Align stock levels with real demand using sales trends and inventory turnover insights to reduce overstock and stockouts.
Stronger Sales Performance
Understand which categories, regions, and customer segments are driving growth and focus efforts where they matter most.
Faster Leadership Decisions
Replace static, delayed reports with live, interactive insights that support faster and more confident decision-making.
Scalable Analytics Foundation
Built to support growing retail networks, new data sources, and increasing analytical complexity without rework.
Transform Retail Intelligence with Tableau
Turn complex retail data into clear, actionable insights with our Tableau Superstore Dashboard solutions.
Success Stories From Our Clients
A leading US-based financial services firm faced increasing challenges…
Result:
28% pipeline success rate
22% Faster Alert Resolution Time
A well-known French perfume retailer wanted to increase profits during the busiest shopping months….
Result:
A leading U.S. financial institution struggled with slow and inconsistent loan approvals…
Result:
40% Decrease in Approval Time
25% Accuracy in Credit Score
- WHY CHOOSE
Why Choose X-Byte Analytics?
X-Byte Analytics delivers Tableau Dashboard Development Services designed for retail operations and not generic templates. We focus on turning complex retail data into dashboards that are easy to use, accurate, and built to support everyday decisions as well as long-term business goals.
Retail-First Dashboard Design
Our dashboards are built around real retail KPIs and workflows, ensuring insights align with how teams actually operate and make decisions.
Strong Data Engineering Foundation
We create clean, reliable, and scalable data pipelines so your dashboards are always powered by accurate and trustworthy data.
Role-Based Views
Executives, sales leaders, finance teams, and operations managers each get views tailored to their responsibilities and priorities.
End-to-End Tableau Analytics Consulting
From initial planning and KPI definition to dashboard optimization and ongoing support, we manage the entire analytics journey.
Future-Ready Architecture
Our dashboards are designed to grow with your business, supporting new stores, data sources, and advanced analytics over time.


