

Key Highlights:
- Learn how a real-time Price Intelligence Dashboard tracks competitor prices, prevents margin leakage, and improves pricing accuracy.
- Understand essential KPIs like price gap, elasticity, promotions, stock matching, and margin impact for smarter pricing decisions.
- Get a complete step-by-step framework to build a Power BI–enabled pricing intelligence system that drives revenue growth & Buy Box wins.
Introduction
In today’s hyper-competitive ecommerce and retail landscape, pricing changes happen in real time-competitors adjust discounts, flash deals, bundle offers, and coupon drops at any moment. If you’re not tracking these shifts continuously, you risk losing margin, market share, and customer trust.
This is where a Price Intelligence Dashboard becomes your strongest competitive advantage. It allows you to track competitor prices live, identify gaps in your pricing strategy, protect your margins, and make smarter, data-driven decisions.
In this guide, you’ll learn how a Competitor Price Monitoring Dashboard works, the essential KPIs it should track, and how to leverage Pricing Intelligence Software to increase profitability.
Why Every Business Needs a Price Intelligence Dashboard?
With the rise of online shopping, modern customers are more price-conscious than ever. They compare prices across marketplaces like Amazon, Walmart, and niche ecommerce platforms to find the best deal. If you’re not actively monitoring competitor prices, you risk:
1. Losing the Buy Box:
For marketplace sellers, this is a critical space where customers make purchasing decisions.
2. Margin Erosion:
Selling products at too low a price while competitors maintain higher margins leads to unnecessary revenue loss.
3. Overpricing Products:
If your products are priced above market expectations, customers will switch to more affordable alternatives.
4. Missed Opportunities:
Competitor price drops happen instantly. Failing to respond quickly means losing potential buyers during high-demand periods.
A Price Intelligence Dashboard provides a real-time view of competitor pricing, helping businesses stay competitive, maintain healthy margins, and make faster, data-backed decisions. When paired with expert the power bi consulting dashboard becomes even more actionable and aligned with your pricing strategy.
What This Dashboard Helps You Understand?
A Price Intelligence Dashboard gives you a clear view of how your prices compare across the market. It highlights key pricing gaps, SKU insights, and competitor trends so you can make faster, data-driven pricing decisions with confidence.
1. How Your Prices Compare with Competitors
The dashboard shows where you stand against competitor pricing across all channels. This helps you quickly adjust prices to avoid being overpriced or underpriced, ensuring consistency and competitiveness.
2. Which SKUs Are Overpriced or Underpriced
It highlights the products that need re-evaluation. Identifying overpriced SKUs prevents lost sales, while spotting underpriced items helps protect margins.
3. Dynamic Pricing Opportunities
Real-time competitor data uncovers opportunities for dynamic pricing. Whether it’s matching a temporary discount, responding to a flash sale, or adjusting for seasonal demand, you can optimize pricing instantly.
4. Pricing Strategy of Competitors
The dashboard reveals patterns in competitor promotions, recurring discounts, or aggressive pricing behavior. This gives you the insight needed to anticipate moves and refine your own pricing strategy accordingly.
Common Business Challenges Solved by Price Intelligence Dashboards
A Competitor Price Monitoring Dashboard helps businesses overcome the most common pricing challenges caused by outdated or incomplete data. It ensures full visibility into competitor movements, margin risks, and inventory issues so teams can take timely, informed actions. With real-time insights, businesses stay ahead instead of reacting late.
- Margin Erosion: Without continuous tracking, businesses can unknowingly sell below their profitability threshold.
- Inventory Buildup: Products that are overpriced may remain unsold, leading to stagnant inventory and lost sales.
- Failing to Respond to Price Wars: Without insight into competitor price movements, you might miss out on counteracting pricing strategies in time.
A real-time dashboard removes these risks by ensuring you have accurate, up-to-date pricing information at all times.
Core Features of a Competitor Price Monitoring Dashboard
A Competitor Price Monitoring Dashboard gives you all the details needed to track pricing changes instantly and protect your margins. It brings together automated data collection, real-time monitoring, and smart alerts to help you respond quickly and stay competitive in fast-moving markets.
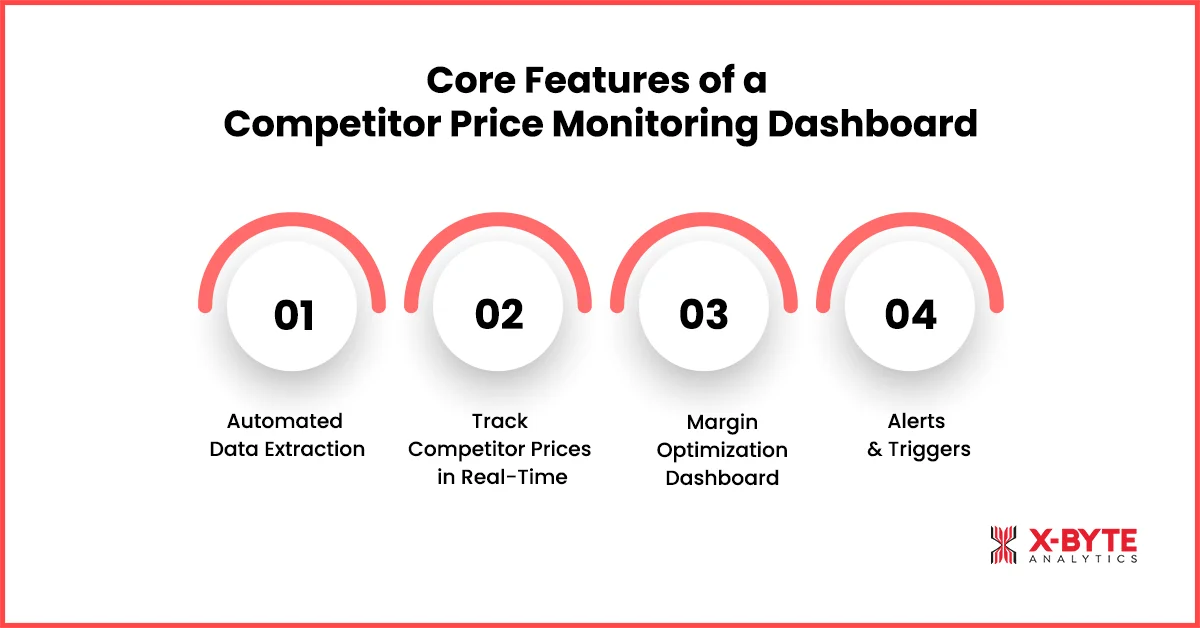
1. Automated Data Extraction
Using automated scraping or API collection, competitor prices are updated multiple times a day. This ensures you’re always working with the latest data, critical for dynamic pricing strategies.
2. Track Competitor Prices in Real-Time
For ecommerce businesses, prices can change quickly-hourly or even more frequently. A Real-time Price Intelligence System ensures you never miss a beat, allowing you to adjust your pricing strategy on the fly.
3. Margin Optimization Dashboard
The dashboard helps you identify products at risk of margin erosion due to pricing pressures. With this information, you can adjust prices to protect your profitability.
4. Alerts & Triggers
Real-time push notifications alert you to any significant changes in competitor pricing. This feature allows you to act quickly and make informed decisions without waiting for end-of-day reports.
Also explore our Power BI Dashboard Guide for deeper insights into data-driven decision-making.
How to Build a Price Intelligence Dashboard?
Building a Price Intelligence Dashboard requires a structured approach that connects competitor data, pricing rules, and real-time insights. By following a clear roadmap, businesses can create a powerful pricing system that supports faster decisions, improves margin control, and strengthens competitiveness.
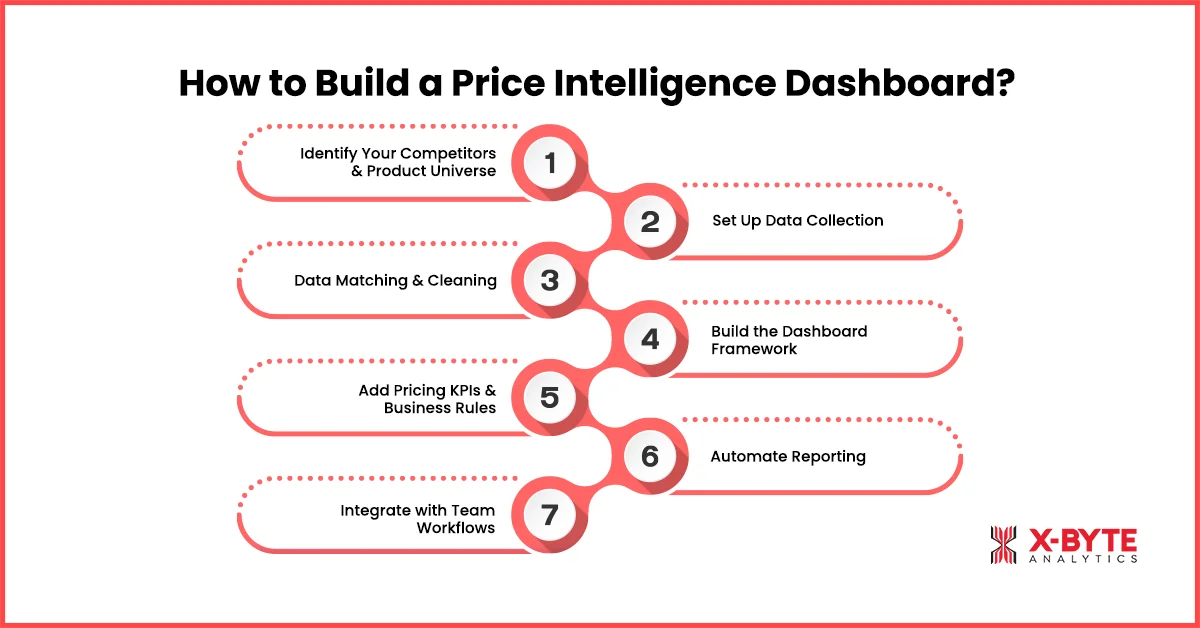
Step 1: Identify Your Competitors & Product Universe
Define all your direct and indirect competitors. Including top-selling and high-margin SKUs is key to focusing your price intelligence efforts on products that matter most.
Step 2: Set Up Data Collection
Use scraping or API ingestion to collect real-time pricing data across marketplaces, competitor websites, and ecommerce stores. This data forms the foundation of accurate pricing intelligence.
Step 3: Data Matching & Cleaning
Normalize product names, titles, and images to ensure accurate comparisons. This step ensures that you’re comparing apples to apples, even if competitors use different naming conventions or packaging.
Step 4: Build the Dashboard Framework
Design a Power BI Dashboard for Price Monitoring that turns raw pricing data into actionable insights. Include key features like SKU comparison, price gap analysis, and margin impact analysis to make data easy to understand and actionable.
Step 5: Add KPIs & Business Rules
Track key KPIs like price gap vs competitors, margin delta, and price elasticity. These metrics will help you evaluate pricing competitiveness and predict the impact of price changes on sales.
Step 6: Automate Reporting
Set up automated data refresh cycles so pricing teams always work with up-to-date information. Automation saves time and ensures teams are always using the latest data for decision-making.
Step 7: Integrate with Team Workflows
Use the dashboard to trigger real business actions, such as automatic repricing or promotion adjustments. This allows pricing teams to react instantly to competitor changes.
Book A Free Consultation With Our Team To Build Your Custom Pricing Dashboard.
Unlock High-Value Insights with Power BI and Pricing Intelligence
Power BI, combined with robust pricing intelligence systems, transforms raw pricing data into powerful insights that can guide business decisions. By consolidating and analyzing data in real-time, Power BI helps businesses make smarter decisions faster, ensuring that pricing strategies align with market dynamics and customer behavior.
Here’s how combining Power BI with pricing intelligence provides high-value insights:
- Visualize Complex Pricing Trends:
Power BI allows you to visualize pricing trends across products, categories, and channels. It turns complex data into easy-to-interpret charts and graphs, helping teams instantly understand how competitor pricing impacts their own pricing strategies. - Interactive Data Exploration:
With Power BI’s interactive dashboards, you can drill down into specific SKUs, competitors, or regions. This flexibility lets you focus on areas with the most significant pricing opportunities or risks. - Predictive Insights Using Machine Learning:
Power BI can integrate machine learning models to predict future pricing trends based on historical data. By forecasting how price changes might affect sales and margins, businesses can make proactive decisions that keep them ahead of competitors. - Automated Data Refresh:
With scheduled refreshes, Power BI ensures your pricing data is always up-to-date. This feature reduces manual effort and ensures that teams are always working with the most accurate information available.
Industry Use Cases for Pricing Intelligence Dashboards
Pricing intelligence dashboards are applicable across industries, helping businesses optimize their pricing strategies, improve competitiveness, and protect margins. Below are industry-specific use cases:
1. Ecommerce & Retail
- Dynamic Pricing & Buy Box Optimization:
Ecommerce platforms like Amazon heavily rely on dynamic pricing strategies to maintain a competitive edge in the Buy Box. Pricing intelligence dashboards allow sellers to adjust prices instantly based on competitor movements, ensuring they stay competitive without sacrificing profitability. - Marketplace Price Comparison:
Retailers selling on multiple marketplaces (e.g., Walmart, eBay) use price intelligence dashboards to monitor their performance against competitors. By identifying price discrepancies and optimizing product listings, they can avoid losing sales and maintain consistent pricing across platforms.
2. Consumer Electronics
- Seasonal Pricing Adjustments:
In the consumer electronics industry, price fluctuations can be significant during seasonal sales events like Black Friday or Cyber Monday. A pricing dashboard enables brands to track competitor prices in real-time, adjust their pricing accordingly, and ensure their products remain competitive during peak shopping periods.
3. Automotive
- Tracking Spare Parts & Accessories Prices:
Automotive brands and dealerships use pricing intelligence to track the prices of spare parts and accessories. By benchmarking their prices against competitors, they ensure their pricing strategies remain profitable while avoiding overpricing or underpricing based on market conditions.
4. Fashion & Apparel
- Promotions & Discount Strategies:
In the fashion industry, price intelligence dashboards help brands track promotions and discounting strategies by competitors. This ensures that pricing remains competitive, especially during flash sales and end-of-season clearances, enabling companies to align their promotions to market trends.
5. Grocery & Supermarkets
- Price Optimization for Perishables:
Grocery stores use pricing intelligence dashboards to track the prices of perishables (e.g., fresh produce, meats). By comparing prices with local competitors and adjusting based on demand and expiration dates, these stores maximize margin and reduce waste.
Essential KPIs for Pricing Intelligence Dashboards
Tracking the right KPIs is crucial for maximizing the effectiveness of your pricing intelligence system. The following are the key performance indicators (KPIs) that every Price Intelligence Dashboard should track to drive actionable insights and strategic decision-making.
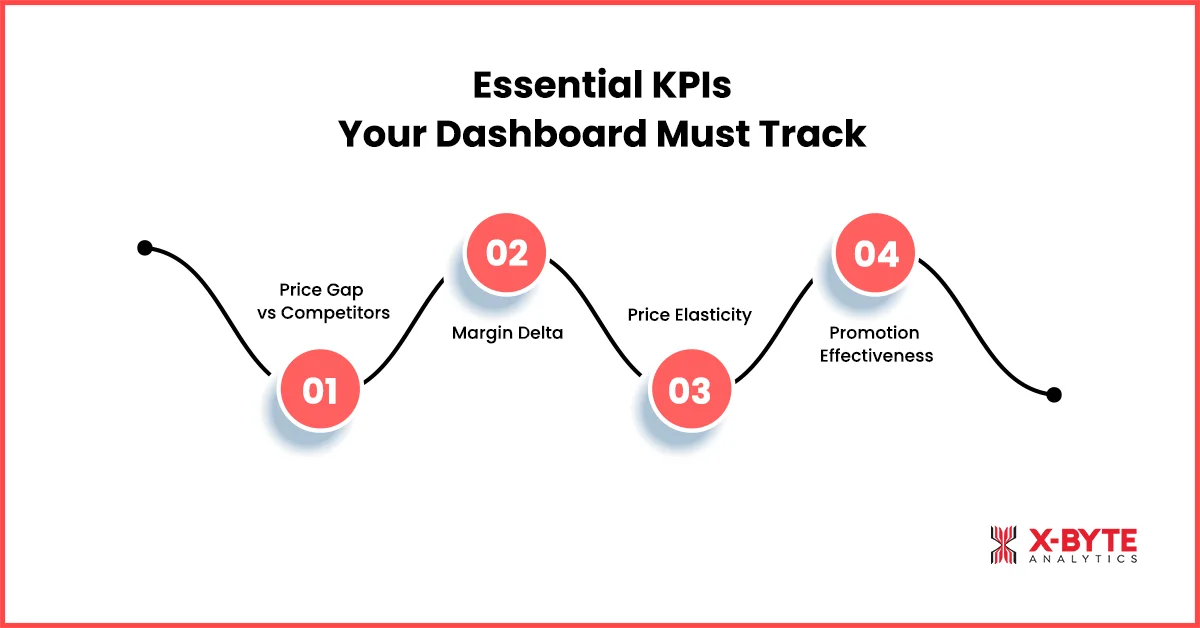
1. Price Gap vs Competitors
The price gap KPI shows how your product pricing compares to competitors’ prices. Tracking this metric helps you identify if you’re overpriced or underpriced relative to the market, which can directly influence competitiveness and sales velocity. For example, if you notice your price is consistently higher than competitors, you might need to adjust it to stay competitive.
2. Margin Delta
Margin delta measures how changes in competitor pricing impact your profitability. When competitors drop their prices, this metric shows how much your profit margin is affected. By tracking margin delta, businesses can decide whether to adjust their pricing or find other ways to maintain margin, such as reducing costs or offering value-added services.
3. Price Elasticity
This KPI helps understand how customer demand changes in response to price changes. It is essential for businesses planning dynamic pricing or conducting A/B testing on discounts. By tracking price elasticity, businesses can make smarter decisions about when to increase or decrease prices to maximize revenue.
4. Promotion Effectiveness
Promotion effectiveness shows whether your discounts or special offers are driving sales or simply cutting into margins. By understanding how promotions impact consumer behavior, you can plan smarter, data-backed promotions that help boost sales without unnecessarily reducing profitability.
Common Mistakes to Avoid in Pricing Intelligence
Pricing intelligence tools are powerful, but without a clear strategy, they can lead to ineffective pricing decisions. Here are some common mistakes to avoid:
1. Tracking Irrelevant Competitors
It’s tempting to track a wide range of competitors, but pricing data becomes cluttered if you’re comparing your prices with irrelevant competitors. Instead, focus only on brands that directly influence your customers’ buying decisions-whether they are direct competitors or those with comparable product offerings.
2. Focusing Solely on Price
Winning on price alone can be tempting, but it leads to margin erosion. While it’s important to track competitor prices, your pricing strategy should reflect your brand value and strategic positioning. Competing solely on price can harm your brand’s image and undermine profitability in the long run.
3. Delayed Pricing Actions
Pricing intelligence data loses value quickly, especially in fast-moving industries like electronics or FMCG. Real-time data is crucial to responding to competitor price drops, price wars, or market shifts. Delayed actions can result in missed revenue opportunities or loss of market share.
4. Ignoring All Cost Factors (Shipping, Deals, etc.)
Customers look at the final payable price, not just the listed price. Ignoring shipping costs, hidden deals, or coupon offers can lead to incorrect competitiveness analysis. These factors must be factored into your pricing intelligence system to give a complete view of the competitive landscape.
5. Overcomplicating Dashboards
When pricing teams need to act quickly, an overly complicated dashboard can lead to decision fatigue. Keep the interface clean and easy to use, focusing on the metrics that matter most. A streamlined, easy-to-read dashboard enhances decision-making speed and accuracy.
Get In Touch With Our Experts To Discuss A Tailored Pricing Intelligence Solution For Your Business.
Conclusion
A Price Intelligence Dashboard is no longer a luxury-it’s a necessity for businesses aiming to optimize margins, stay competitive, and make informed pricing decisions. By leveraging pricing intelligence software and real-time competitor price monitoring, businesses can swiftly adjust their strategies to maximize profitability, prevent margin loss, and improve competitiveness.
Whether you’re a large retailer, D2C brand, or marketplace seller, implementing a pricing intelligence solution will provide the actionable insights needed to stay ahead in today’s dynamic market. Investing in real-time price monitoring and dynamic pricing models is a smart move that will drive significant improvements in your pricing strategy, profitability, and customer loyalty.


