

Quick Summary
Power BI is expanding as an advanced and business friendly tool that provides an interactive and easy-to-understand dashboard by compiling data from various sources. In this detailed blog, we will understand different types of Power BI dashboards with features and KPIs and their pros and cons. This blog will also outline the key components of the Power BI dashboard that make it more intuitive and user-friendly.
Introduction
In 2025, Power BI continues to be a dominant force in the business intelligence (BI) space. From small startups to large enterprises, businesses rely on Power BI to gain valuable insights, improve decision-making, and optimize operations. Whether you’re aiming to streamline your financial processes, enhance marketing efforts, or track project progress, Power BI Dashboard Examples are crucial for providing actionable insights in real-time.
With its seamless integration, real-time data access, and user-friendly interface, Power BI enables businesses across various industries to harness the full potential of their data. In this blog, we’ll explore 15 Power BI Dashboard Examples that showcase diverse use cases, key performance indicators (KPIs), and features that will drive business success in 2025.
The Power of Power BI: Key Features Driving Data Insights
Before diving into the Power BI Dashboard Examples, it’s essential to understand the core features that make Power BI so powerful and versatile in 2025, especially when paired with insights from platforms like Statista:
- Real-Time Data Access: Power BI dashboards offer live data streams, allowing businesses to make real-time decisions. This feature ensures that your organization can act swiftly, based on the most up-to-date information available.
- Seamless Integration: Power BI integrates effortlessly with a wide range of data sources, including popular platforms such as Excel, SQL Server, cloud-based tools, and even external APIs. With the help of Statista, users can also enrich their dashboards with valuable industry insights.
- Customizable Visualizations: Power BI allows businesses to design tailored dashboards to monitor key metrics, such as sales performance, financial health, and customer satisfaction. These customizable visualizations help to present data in the most impactful way.
- Predictive Analytics: The built-in AI tools within Power BI forecast trends, customer behavior, and market shifts, helping businesses stay ahead of the curve. This predictive power is even more enhanced when combined with reliable data sources like Statista, allowing businesses to base their forecasts on accurate, real-world data.
Represent the large amount of data with custom dashboards and streamline the decision making process.
15 Best Power BI Dashboard Examples to Use in 2025
1. Power BI Financial Dashboard: Keep Your Finances on Track
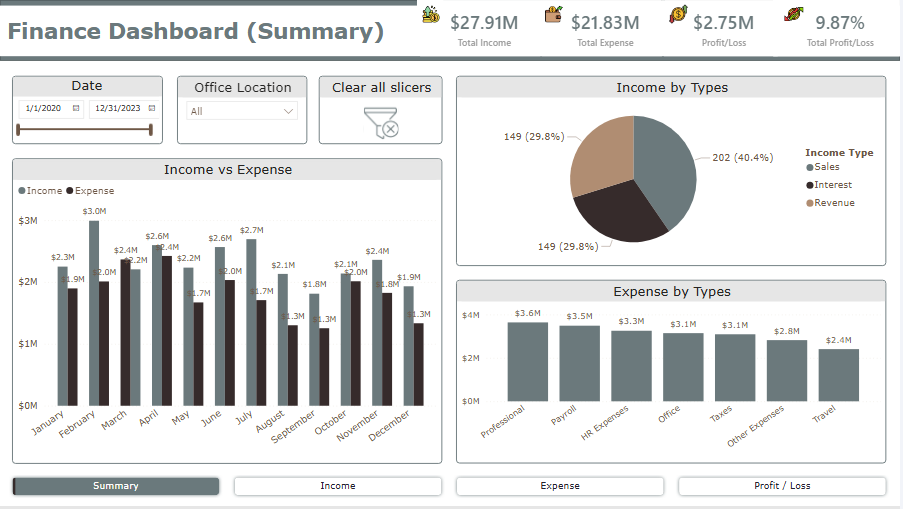
The Power BI Ecommerce Dashboard tracks e-commerce sales trends, customer behavior, and website performance. Additionally, the financial KPI dashboard helps monitor and analyze the organization’s financial health, enabling real-time fund management and tracking financial metrics for better decision-making.
Key Features:
- Revenue Growth Rate
- Cash Flow Analysis
- Debt-to-Equity Ratio
- Return on Investment (ROI)
Pros
- Live financial data updates.
- Streamlined budget tracking.
Cons
- Requires continuous updates for accurate analysis.
2. Power BI Sales Dashboard: Boost Sales Performance

The Power BI Sales Dashboard allows sales teams to track performance, conversion rates, and customer acquisition costs.
Key Features:
- Sales Revenue
- Conversion Rate
- Customer Acquisition Cost (CAC)
Pros
- Insight into sales trends across regions.
- Helps with sales forecasting and target tracking.
Cons
- Needs integration with CRM systems like Salesforce.
3. Power BI Healthcare Dashboard: Streamline Patient Management

The healthcare management dashboard helps track patient care, hospital performance, and appointment management. It also enhances hospital operations by integrating real-time data for managing patient status, appointments, staff attendance, and equipment availability, making healthcare management more efficient.
Key Features:
- Bed Occupancy Rate
- Patient Admission/Discharge Rates
- Appointment Wait Time
Pros
- Ensures better resource allocation and care.
- Tracks important health metrics for enhanced service delivery.
Cons
- Requires customization for specific healthcare setups.
4. Power BI Inventory Dashboard: Optimize Your Supply Chain
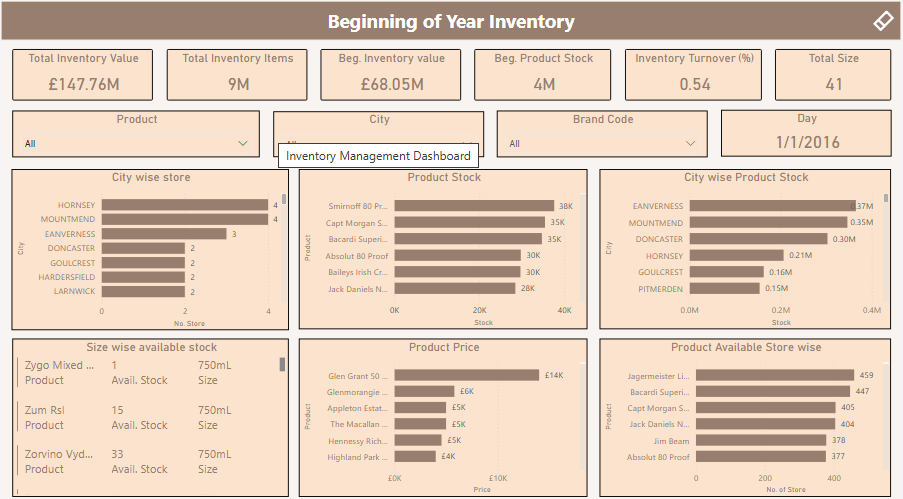
Large-scale retailers and warehouses can leverage the Power BI inventory management dashboard to manage stock levels, costs, and vendor performance.
Key Features:
- Inventory Restocking Costs
- Vendor Management
- Inventory Value by Item and Vendor
Pros
- Real-time inventory updates.
- Reduces the chances of stockouts and overstocking.
Cons
- Complex to set up with multiple vendors.
5. Power BI Project Management Dashboard: Track Timelines & Resources
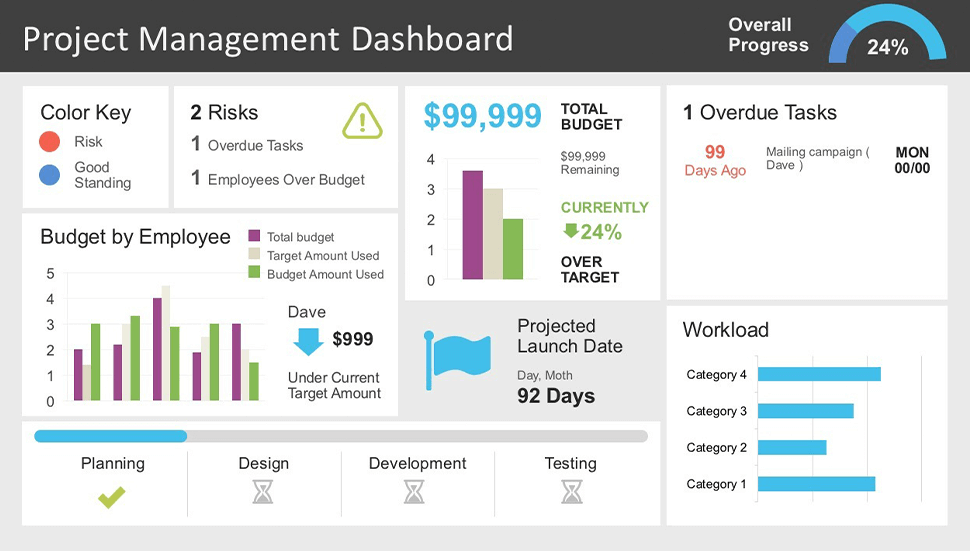
The Power BI Project Management Dashboard helps project managers track milestones, deadlines, and resource allocation.
Key Features:
- Project Completion Percentage
- Budget vs. Actual Tracking
- Resource Allocation Efficiency
Pros
- Keeps projects on track and within budget.
- Real-time project updates for better collaboration.
Cons
- Requires integration with project management tools like Microsoft Project.
6. Power BI Marketing Dashboard: Drive Marketing Success
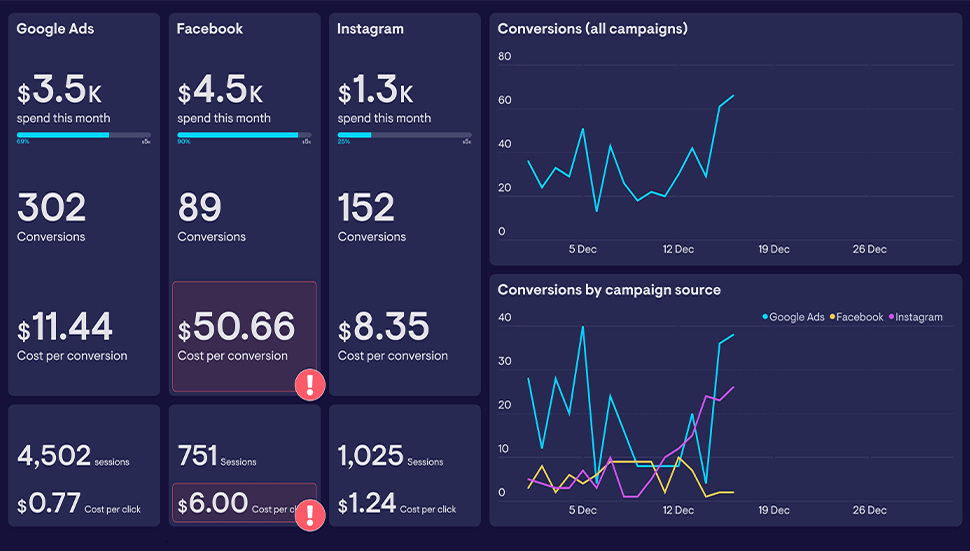
Marketing teams can use the Power BI Marketing Dashboards to track campaign performance across various channels, including social media, email, and paid ads.
Key Features:
- Marketing ROI
- Website Traffic & Conversions
- Social Media Engagement
Pros
- Real-time insights into campaign performance.
- Refines marketing strategies for better ROI.
Cons
- Needs integration with platforms like Google Ads and HubSpot.
7. Power BI IT Dashboard: Monitor IT Performance
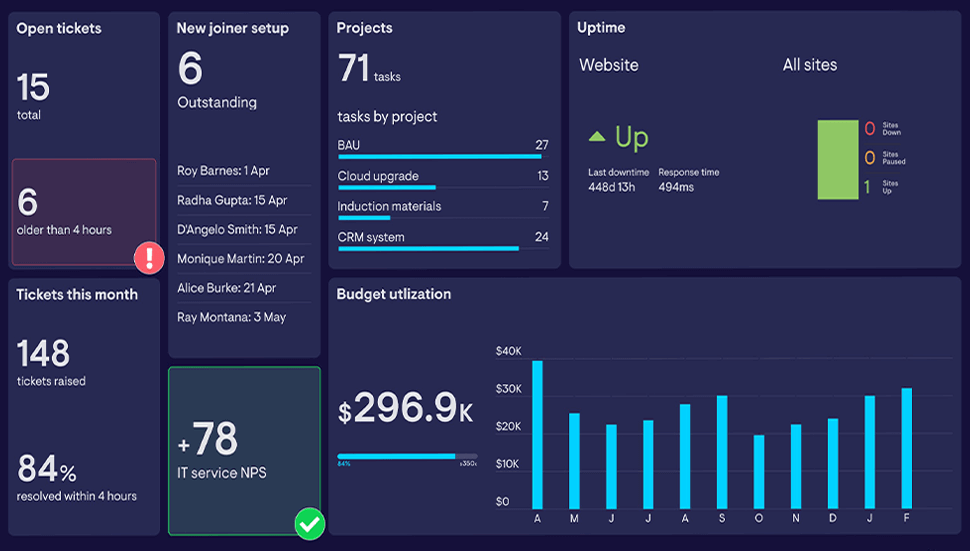
For IT teams, the Power BI IT Dashboard helps track system uptime, incident response, and IT performance metrics.
Key Features:
- System Uptime/Downtime
- Incident Response Time
- Number of IT Tickets Resolved
Pros
-
- Enhances IT service management.
- Reduces downtime and improves operational efficiency.
Cons
-
- Requires integration with IT management tools like ServiceNow.
8. Power BI Logistics Dashboard: Streamline Supply Chain Efficiency
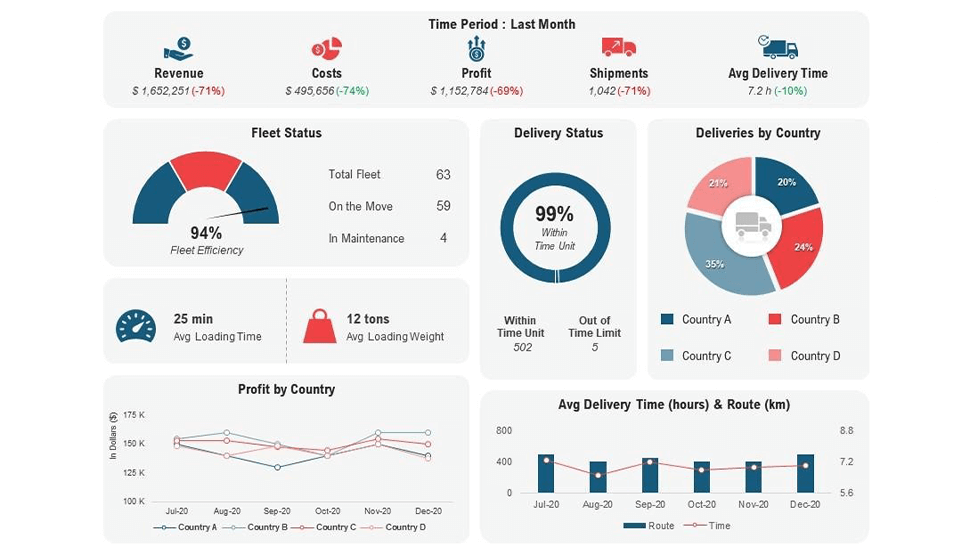
The Power BI Logistics Dashboard enables businesses to monitor delivery performance, freight costs, and shipping errors.
Key Features:
- On-Time Delivery Rate
- Freight Cost Analysis
- Shipping Error Rate
Pros
- Optimizes logistics operations.
- Improves customer satisfaction by ensuring timely deliveries.
Cons
- Requires integration with logistics platforms.
Transform the data analysis process with our expertise in advanced technology to create the interactive dashboard.
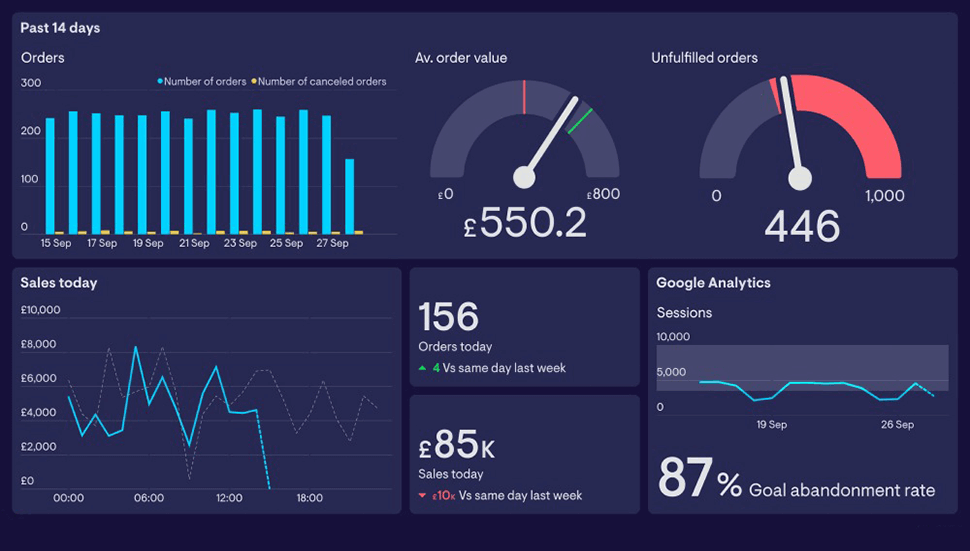
9. Power BI Ecommerce Dashboard: Track Your Online Store Performance
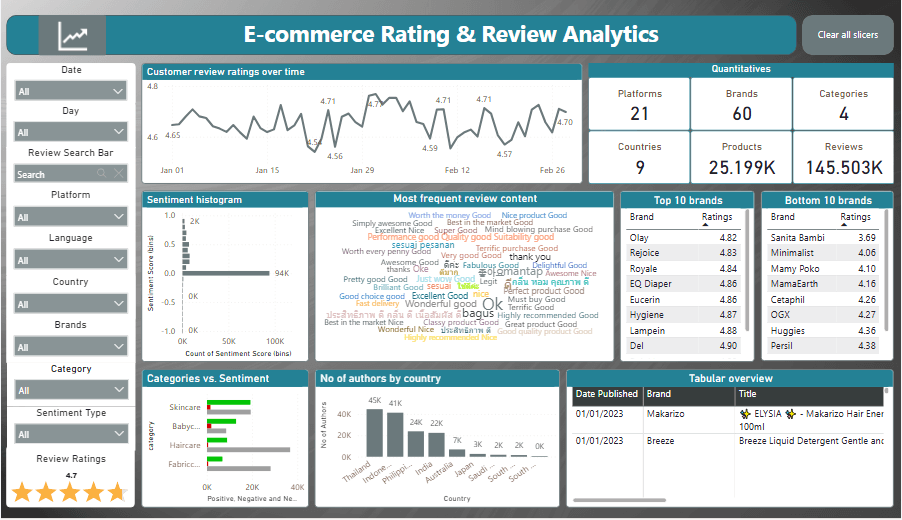
Establish a streamlined and scalable online retail store to reach customer segments and fulfill their needs. To drive growth, the eCommerce dashboard helps track sales trends, customer behavior, and website performance. With a high-performing eCommerce dashboard, online stores can easily monitor and optimize their store’s performance.
Key Features:
- Conversion Rate
- Average Order Value (AOV)
- Cart Abandonment Rate
Pros
- Provides deep insights into customer behavior.
- Enhances marketing and sales strategies.
Cons
- Needs integration with e-commerce platforms like Shopify.
10. Power BI Business Dashboard: Monitor Company-wide Performance
The Power BI Business Dashboard consolidates data from all departments to offer a holistic view of your company’s performance.
Key Features:
- Revenue Growth Rate
- Gross Profit Margin
- Customer Satisfaction Score (CSAT)
Pros
- Supports high-level decision-making.
- A comprehensive tool for executives.
Cons
- Too much data may overwhelm the user.
11. Power BI Real Estate Dashboard: Track Property Performance
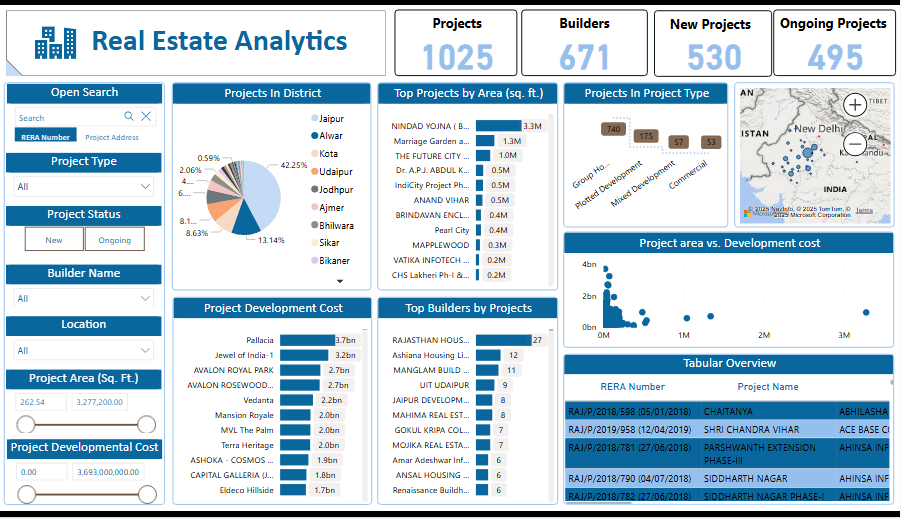
The comprehensive real estate dashboard enables real estate businesses to track property performance, rental income, and market trends. With Power BI’s capabilities, it provides valuable insights to optimize property management and investment strategies. This dashboard helps businesses make data-driven decisions and stay ahead in the competitive real estate market.
Key Features:
- Occupancy Rate
- Rental Income by Property
- Property ROI
Pros
- Offers insights into investment opportunities.
- Tracks rental income and property performance in real-time.
Cons
- Requires integration with property management systems.
12. Power BI Manufacturing Dashboard: Optimize Production Processes
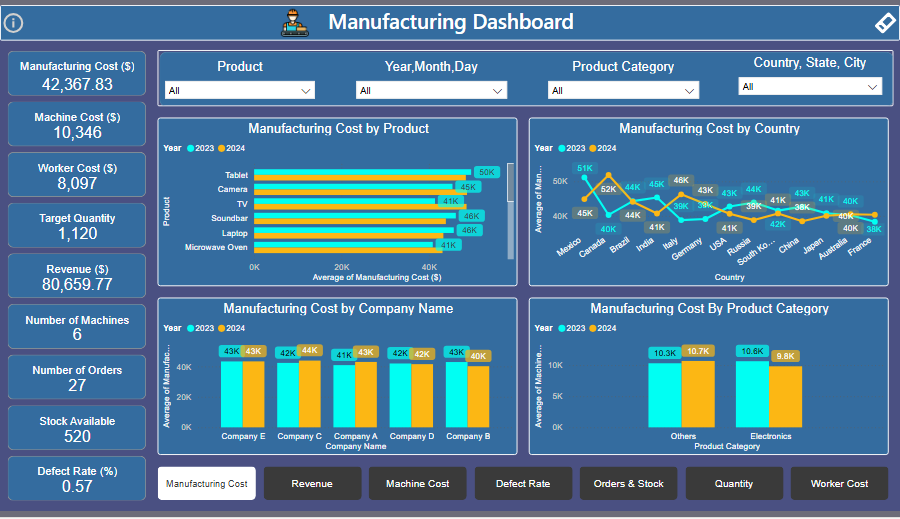
Manufacturers can use the production dashboard in Power BI to track production output, efficiency, and operational costs. This dashboard provides real-time insights, helping businesses optimize manufacturing processes and improve overall performance.
Key Features:
- Production Output
- Cycle Time
- Downtime Analysis
Pros
- Improves production efficiency.
- Identifies cost-saving opportunities.
Cons
- Needs integration with manufacturing systems.
13. Power BI CMO Dashboard: Optimize Marketing Campaigns
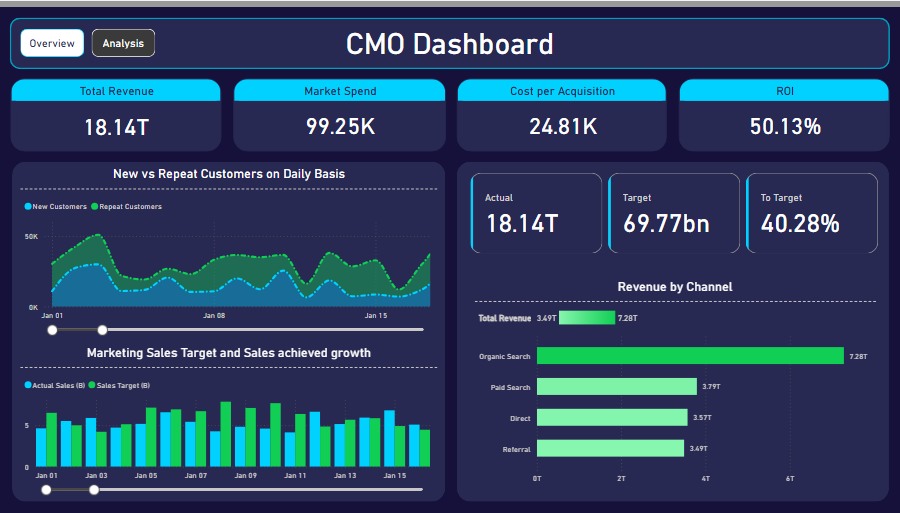
Marketing executives can rely on the Power BI CMO Dashboard to track campaign performance, brand awareness, and engagement rates.
Key Features:
- Campaign Performance Metrics
- Brand Awareness
- Engagement Rate
Pros
- Aligns marketing strategies with business goals.
- Measures marketing success accurately.
Cons
- Requires integration with Google Ads and other tools.
14. Power BI CEO Dashboard: Get a High-Level Overview
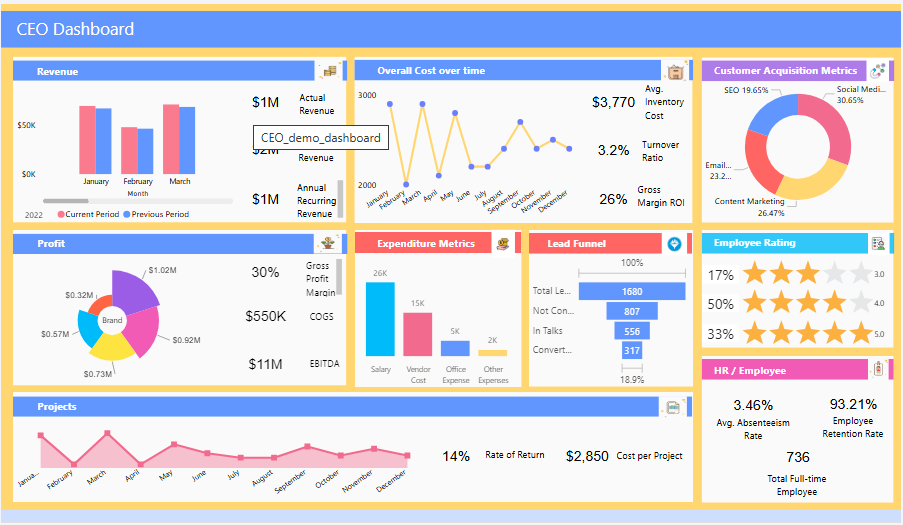
The custom CEO dashboard in Power BI allows executives to track company performance across all departments with real-time insights into key business metrics. This tailored dashboard helps leaders make informed decisions and monitor organizational success more effectively.
Key Features:
- Company Revenue vs. Expenses
- Profit Margins
- Customer Satisfaction Score (NPS)
Pros
- Provides a high-level overview of performance.
- Facilitates data-driven decision-making.
Cons
- Needs accurate data from all departments.
15. Power BI HR Dashboard: Streamline Employee Management

HR teams can use the Power BI HR Dashboard to track employee performance, turnover rates, and workforce productivity.
Key Features:
- Employee Turnover Rate
- Training Completion Rates
- Absenteeism Rate
Pros
- Improves workforce planning and retention strategies.
- Enhances employee satisfaction and engagement.
Cons
- Requires integration with HR tools.
Build Power BI Dashboards To Transform Your Business
Power BI is a robust platform that helps in transforming complex data into actionable insights that help in smarter decision-making processes. To maximize its potential, your internal team must be skilled, or you can outsource to experts who provide you with market-leading dashboard solutions. X-byte Analytics provides custom Power BI dashboards to help your business grow and automate the business.
With X-Byte Analytics, your business can get:
- Comprehensive and integrated solutions
- Market-leading dashboards
- Progress tracking and analytics
- Streamlined decision-making process
- Real-time analytics
Discover how X-Byte Analytics can help your business seize market opportunities and reduce efforts in compiling data from diverse sources. With our expert services, your business can stay ahead of the curve in the data-driven market.
Conclusion
Power BI Dashboards offer unmatched flexibility, scalability, and functionality. By leveraging the right dashboard for your business, you can unlock actionable insights that help make smarter decisions, improve operational efficiency, and accelerate growth. Whether you’re in finance, healthcare, marketing, or IT, there’s a Power BI solution tailored to your needs.


