Key Highlights:
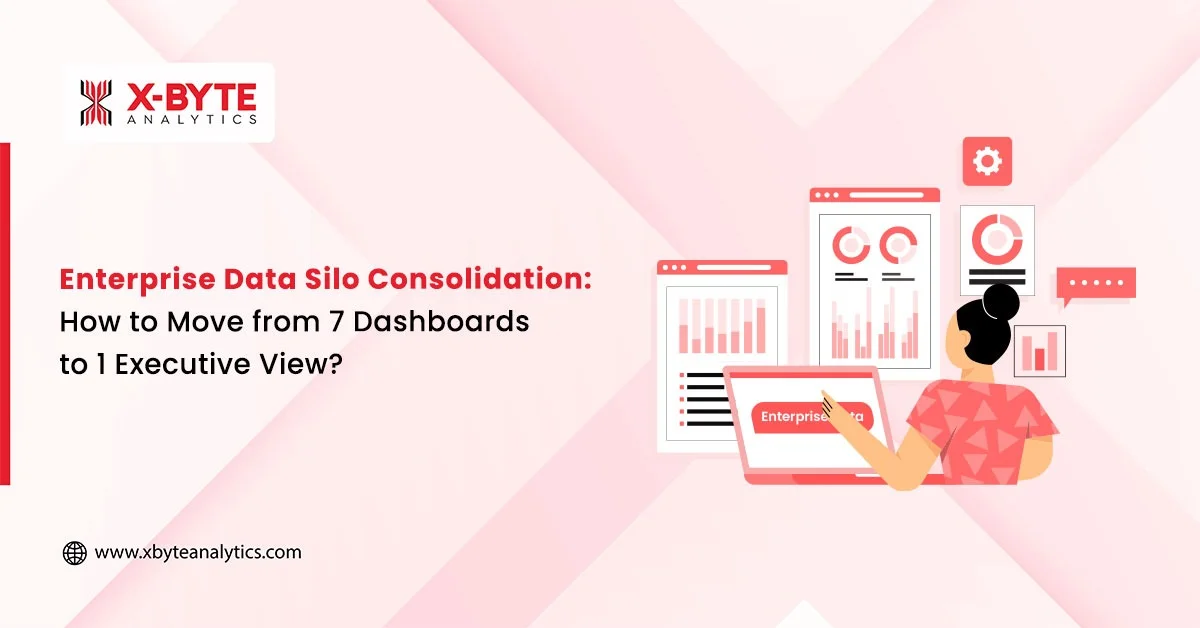
- Enterprise Data Silo Consolidation replaces 7+ disconnected dashboards with one centralized executive dashboard to improve data accuracy, trust, and cross-departmental alignment.
- A unified business intelligence strategy built on a modern data stack and scalable data architecture reduces reporting time, improves forecast accuracy & enables faster decision-making.
- Consolidating dashboards delivers measurable ROI, including 30–50% BI cost reduction, higher executive productivity, and stronger departmental alignment.
Introduction
Your executive team makes million-dollar decisions based on data they don’t entirely trust. Not because the data is wrong, but because no one can definitively say which version is right.
Sales reports one customer’s lifetime value. Finance calculates another. Marketing’s attribution model shows different numbers entirely. When your CFO asks a simple question, What’s our actual customer acquisition cost? The room goes quiet. Someone volunteers to pull the data and get back to you.
Three days and seven spreadsheets later, you have an answer. Maybe.
This isn’t just frustrating. It’s expensive. Executives spend several days searching for, reconciling, or validating data instead of actually using it to make decisions.
Research cited by EIN Presswire found that eliminating data silos in large organizations saves an average of $12.9 million annually through faster decisions, reduced duplication, and better alignment across teams.
Your competitors who’ve solved this aren’t just moving faster; they’re making fundamentally different strategic decisions because their data tells one unified story. This guide shows you how to get there: why enterprise data silos form, what consolidating multiple business dashboards actually delivers, and the five-step framework for building a single source of truth that transforms how your organization operates.
Why Enterprise Data Silos Are Killing Efficiency?
Enterprise data silos happen when your business tools don’t talk to each other.
- Salesforce holds your customer information.
- Google Analytics tracks website behavior.
- Your ERP system manages inventory and finances.
- HubSpot contains marketing data.
Each system works fine independently. The problem hits when you need to see the complete picture.
For instance, you might spot a customer trend in your CRM, but miss that your supply chain can’t support the demand. Or you’ll see strong website traffic in analytics, but you won’t know if those visitors are actually converting to revenue because that data lives somewhere else.
These disconnected systems create four major problems that directly impact your bottom line:
- Lost Revenue Opportunities: When sales data doesn’t connect with marketing performance and customer behavior data, you can’t identify which channels drive your most profitable customers.
- Real example: SaaS companies frequently discover after consolidation that organic channels outperform paid ads by 2-3x in customer LTV, yet they’ve been allocating 70% of their budget to paid.
- Slower, Less Confident Decisions: Due to these delays, opportunities slip through the cracks, competitors launch first, pricing windows close, and market shifts happen while you’re still validating last quarter’s numbers.
- Compliance and Security Risks: When customer data exists in seven different systems, each with different security protocols and access controls, you multiply your vulnerability, Organizations with highly fragmented data environments experience higher breach costs. As, they can’t quickly identify where sensitive data lives or who has access to it.
- Team Burnout and Turnover: Your analysts spend their days as data janitors instead of strategic thinkers. Manual tasks pile up: downloading CSVs, reformatting spreadsheets, cross-checking numbers across systems, This leads to stress, pressure, burnout, and ultimately turnover. You lose institutional knowledge and spend months training replacements, who inherit the same broken process.
The irony? Most of these silos emerged because different departments solved real problems with the best tools available at the time, and there is a gap in cross-team visibility. But what worked for individual teams has become an enterprise-wide liability.
Benefits of Enterprise Data Silo Consolidation & Having a Single Unified Dashboard
When enterprises move from multiple dashboards to one unified executive dashboard, decision-making becomes faster and clearer. A single source of truth (SSOT) improves data accuracy and forecast confidence, while automated ETL pipelines reduce reporting effort and free teams from manual work.
The result is lower BI tool costs, better ROI of unified data analytics for executives, and smarter decisions driven by consistent, trusted data, all from one centralized view.
Here’s what this transformation looks like across eight critical business metrics:
| Metric | 7 Separate Dashboards | 1 Unified Dashboard |
| Time to Generate Executive Report | 2 days (manual compilation) | 2 hours (automated) |
| Decision-Making Speed | Weekly or monthly cycles | Real-time or daily |
| Executive Productivity | Baseline | 40% improvement |
| Forecast Accuracy | 68% (inconsistent data sources) | 89% (unified historical data) |
| Annual Tool Licensing Costs | $180K-$400K (multiple platforms) | $90K-$200K (50% reduction) |
| Data Accuracy Confidence | 65% (frequent discrepancies) | 94% (single source of truth) |
| Team Hours Spent on Reporting | 120 hours/month | 25 hours/month |
Key Takeaway: Higher ROI of Unified Data Analytics for Executives!
When you combine direct cost reduction, reclaimed team hours, and faster, more accurate decision-making, bringing your data together consistently returns 1.2x–1.8x the investment annually.
That’s why centralized executive dashboards, built on a unified BI approach and modern data stack for enterprise, are viewed as revenue enablers and high-impact business investment, not IT expenses.
Ready to Build Your Consolidation Case?
If those numbers resonated, 40% productivity gains, 50% cost reduction, 89% forecast accuracy, take the next step with me.
Book a Free Strategy Session with Our BI Team.
How to Consolidate Multiple Business Dashboards? The End-to-End Guide!
Enterprise data consolidation isn’t a single project; it’s a structured process that typically takes 4-6 months from audit to full deployment. Most successful consolidations follow this pattern:
1. Audit Your Current Dashboard and Data Landscape
Before you can consolidate, you need to know exactly what you’re working with.
What to do: Create a complete inventory of every business intelligence tool, dashboard, and reporting system your organization uses. Don’t just ask IT, survey each department because marketing, sales, finance, and operations often run tools that IT doesn’t even know about.
For each system, document:
- What data does it contains
- Who uses it and how often
- What decisions depend on it
- How it connects (or doesn’t) to other systems
- What it costs annually
Timeline: 2-3 weeks
Pro tip: You’ll likely discover 2-3 additional shadow dashboards that individual teams built with tools like Excel or Google Sheets. These matters because they reveal gaps in your official systems, as people create workarounds when the approved tools don’t meet their needs.
2. Choose Your Unified Business Intelligence Platform
Not all consolidation platforms handle enterprise needs equally well. Your choice should match your organization’s technical capabilities and strategic requirements.
What to do: Evaluate platforms based on four criteria:
- Data source connectivity: Can it pull from all your current systems without custom coding?
- Scalability: Will it handle your data volume in three years, not just today?
- User accessibility: Can non-technical executives actually use it, or does every question require an analyst?
- Total cost of ownership: Look beyond licensing to implementation, training, and ongoing maintenance
Common enterprise options include:
- Power BI if you’re Microsoft-heavy
- Tableau excels at ad-hoc exploration
- Looker is powerful for SQL-literate teams
Timeline: 3-4 weeks (including vendor demos and stakeholder input)
Tip from our X-Byte Analytics Team: Run a proof-of-concept with your messiest, most important use case before committing. If the platform can elegantly handle your most complex reporting needs, you have found your match. – Jatin Kosti, Data Scientist
3. Map Data Flows and Build Integration Architecture
This is where many consolidation projects stall. You’re not just connecting systems, you’re establishing how data moves, transforms, and updates across your entire organization.
What to do: For each data source, determine:
- How often does data need to be refreshed (real-time, hourly, daily, weekly)
- What transformations are required (currency conversions, category standardization, duplicate removal)
- Which system is the source of truth for each data type
- What happens when source systems have conflicting information
Build your data integration architecture using APIs where available and ETL pipelines for systems that don’t offer direct connections. This is typically where you’ll need technical expertise, and our business intelligence services team specializes in this phase.
Timeline: 6-8 weeks
Our data expert at X-Byte Analytics said that, start with one critical data flow (like connecting your CRM to financial data for revenue reporting) and get it working perfectly before adding complexity.
4. Cleanse and Standardize Your Data
Your unified dashboard is only as good as the data feeding it. This step addresses the reality that customer names, product categories, and regional definitions vary wildly across systems.
What to do: Establish master data management rules for your most important data entities:
- Customer records: How do you handle duplicates, subsidiaries, and name variations?
- Product hierarchies: Do categories align across sales, finance, and operations?
- Time periods: Do all systems use the same fiscal calendar?
- Geographic regions: Are the territory definitions consistent?
Create a data governance framework that assigns ownership for each master data domain. Someone needs authority to decide that Acme Corp and Acme Corporation are the same customer.
Timeline: 4-6 weeks (ongoing refinement)
Pro tip: Don’t aim for 100% perfect data before launch. Get to 85% accuracy, launch to a pilot group, and let real usage reveal which data quality issues actually matter versus which are theoretical concerns.
5. Test, Launch, and Train Your Teams
A centralized executive dashboard fails if people don’t trust it or don’t know how to use it.
What to do:
- Parallel testing (3-4 weeks): Run the new unified dashboard alongside existing systems. Compare outputs daily and investigate discrepancies. This builds confidence that the new system is reliable.
- Pilot launch (4-6 weeks): Deploy to a small group of power users, typically analytics leads from each department. They’ll stress-test the system and identify usability issues before company-wide rollout.
- Training program: Don’t just do a single training session. Create role-specific materials (executives need different training than departmental analysts), record video walkthroughs, and establish office hours where people can get help.
- Sunset old systems: Set a firm date to turn off old dashboards. If you leave them running indefinitely, people will revert to familiar tools, and your consolidation will fail.
Timeline: 8-12 weeks from initial testing to full deployment
Pro tip: Identify executive champions for the new system, leaders who will publicly commit to making decisions based on the unified dashboard and hold their teams accountable for using it. Cultural adoption is more important than technical perfection.
Overcoming Common Challenges in Implementing Unified Business Intelligence Strategy
Even with a solid framework, you’ll face predictable obstacles. Here’s how to address the four most common roadblocks:
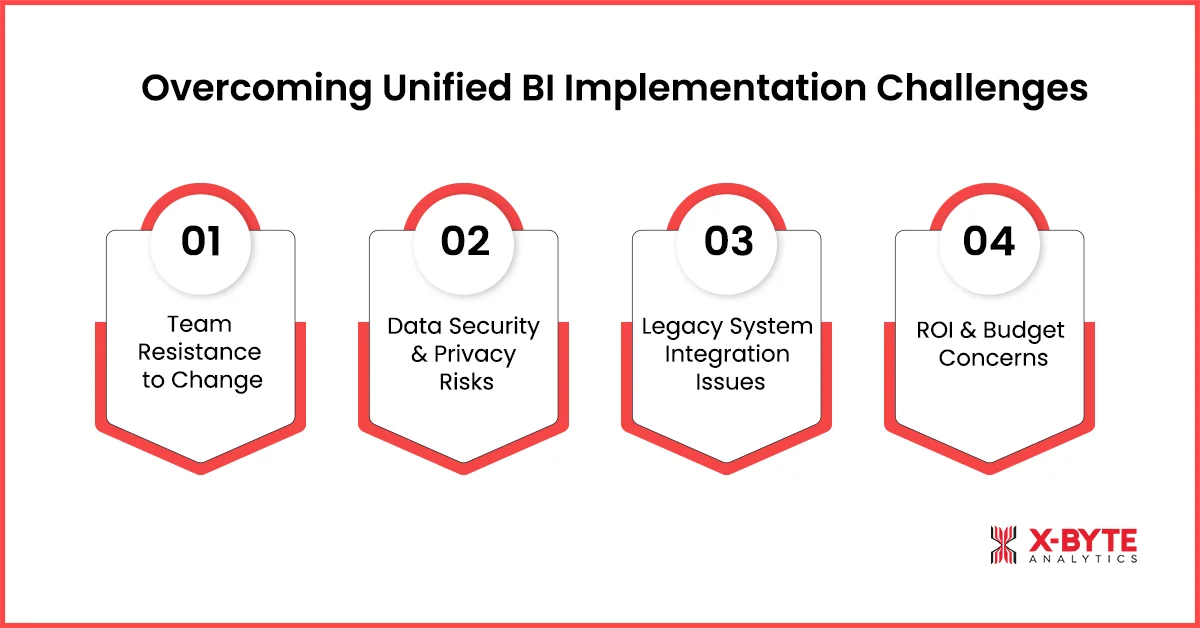
1. Resistance to Change from Teams Attached to Their Tools
When you announce consolidation, expect pushback disguised as technical concerns.
The real issue: People fear losing visibility into metrics they’re accountable for, or they worry the new system won’t support their specific workflows.
The solution: Don’t force a one-size-fits-all dashboard. Your integrated business intelligence services strategy should create a single data foundation while allowing customized views for different roles.
Marketing can still have its attribution dashboard; it just pulls from the same clean data as the executive view.
Include department leads in the design process so they shape how their data appears rather than having a solution imposed on them.
Also, run pilot programs because when their peers see colleagues successfully using the new system, adoption accelerates.
Lesson from the Field: In 70% of our consolidation projects, the biggest delay isn’t technical, it’s getting Finance and Sales to agree on how to calculate closed-won revenue. Finance wants accrual-based. Sales want cash-based. This political fight can stall projects for weeks.
Our solution: Create both views in the unified dashboard and let executives choose which lens they want for different decisions. Compromise beats gridlock.
2. Data Security and Privacy Concerns
The real issue: Consolidating data means more people potentially have access to sensitive information. Your legal and compliance teams will rightfully ask: If everything’s in one place, how do we prevent unauthorized access?
The solution: Implement role-based access controls from day one. Just because data lives in one platform doesn’t mean everyone sees everything.
Modern platforms support row-level security, field-level permissions, and audit logging that actually exceed the security of fragmented systems.
Work with your security team to define access tiers before implementation.
Consider zero-trust security models where access is granted based on specific business needs rather than department membership.
3. Integration Complexity with Legacy Systems
Your organization runs a 15-year-old ERP system that wasn’t designed to integrate with modern cloud platforms.
The solution: You have three options, each with tradeoffs:
- API integration: If possible, this is the cleanest. Even limited APIs can extract essential data on a scheduled basis.
- Database replication: For systems with accessible databases, you can replicate data to a modern data warehouse without touching the legacy application itself.
- Scheduled exports: As a last resort, automated CSV exports can feed your unified platform. It’s not elegant, but it works.
Don’t let one difficult legacy system derail the entire project. Start with easier integrations to build momentum, then tackle the complex system with dedicated resources or specialist consultants who’ve solved that specific integration before.
4. ROI Doubts and Budget Approval Challenges
Your CFO hears a 4-6 month project requiring platform licenses, implementation partners, and staff time, and questions whether the juice is worth the squeeze.
The solution: Build your business case around three measurable categories:
- Hard cost savings: Calculate current spending on multiple platform licenses, IT support hours, and analyst time spent on manual reporting. Most organizations find 40-50% savings here alone.
- Opportunity cost recovery: Quantify executive and analyst time currently spent gathering and reconciling data. If your leadership team spends 10 hours per week on this, that’s 500 hours annually saved that could go toward strategy.
- Risk reduction: Assign a dollar value to compliance penalties you’re avoiding and revenue losses from delayed decisions. If being one week faster to market with pricing adjustments is worth $500K annually, include it.
Pro-Tip: Share quick-win examples from similar organizations & propose a phased approach if the budget is tight: Start with sales and finance first, prove the measurable business value, then expand to other functions.
Accelerate Enterprise Data Consolidation With X-Byte Analytics Experts
Getting Started: Your Roadmap to One Dashboard
Companies that consolidate their enterprise data silos don’t just save time and money; they spot opportunities faster, respond to threats earlier, and align their teams around a shared truth instead of departmental perspectives.
If you’re ready to explore what unified business intelligence could look like for your organization, then we at X-Byte Analytics can help you navigate this.
Our team brings expertise in Power BI development services, Tableau consulting, and comprehensive business intelligence services designed to turn fragmented data into a strategic advantage.
Whether you’re just starting your consolidation journey or stuck on a complex integration challenge, we can help you build a roadmap that fits your specific needs. Book a free 30-minute consultation with our team to discuss your current dashboard landscape and discover how we can help you move from chaos to clarity.