Data Visualization Company in USA

Expand your expertise with our data visualization consulting services to create a user-centric display of data. Our personalized data visualization services in the USA assist decision-makers in getting easy-to-understand reports.

Data Visualization Company in USA

Trusted by conglomerates, enterprises, and startups

Transform Complex Facts with Data Visualization Company in the USA

Transform Complex Facts with Data Visualization Company in the USA

X-Byte Analytics is a leading data visualization consulting company that helps design and create appealing presentations of complex data. We provide customized data visualization services in the USA based on your needs and the KPIs you want to measure. Our end-to-end data visualization services assist in creating intuitive data presentations to enhance data presentation.

Why choose X-Byte for data visualization consulting services?

Achieve Digital Excellence With Our Expertise in Data Analytics

12+

Years Experience

250+

IT Professionals

1500+

Successful Projects

900+

Happy Customers

40+

Industries Served

24/7

Support Services

Data Visualization Consulting Services We Offer

Our expert team of professionals provides visually appealing visualizations to present complex data in an easy to understand manner. Our data visualization consulting services assist businesses in understanding and cleansing databases, allowing for better analysis.

Data Visualization Implementation

We employ specialized tools and techniques to present data in visually appealing forms. We are a prominent data visualization consulting company that provides AI-powered data visualization and implementation services. Our professionals will use insights, patterns, and trends to present the data to businesses.

Custom Dashboard Development

We provide custom dashboards designed to fulfill the requirements of various business segments. These dashboards assist in informed decision making and simplifying data in easy to understand form. This makes accessing and analyzing your data more accessible, leading to improved decision-making.

Dashboard Optimization

Optimizing the dashboards based on requirements is essential for a better and quicker decision-making process. Our expert optimization services ensure easy to understand reports and filters on dashboards based on essential KPIs. Our team ensures seamless data visualization and effective dashboards suitable for professionals.

Data Visualization with Cloud Services

Our team utilizes the latest cloud technologies to ensure accessibility to data visualization activities. We utilize the most advanced and preferred cloud platform for better performance and data presentation. Through this, businesses can monitor the data in real time from anywhere worldwide.

BI Migration

We provide seamless Business Intelligence (BI) migration services to our clients that help them stay updated with the changing market trends. Our team specializes in hassle-free data migration and presentation using advanced and future-ready tools.

Data Platform Development

We specialize in creating custom data visualization platforms that manage data from start to finish. Our team gathers, cleans, and combines data from different sources. We can help you organize, share, and analyze your data. We design data management platforms with a powerful BI tool and data warehouse.

Contact Us Today

To transform the decision-making process by utilizing advanced data visualization solutions and tools.

Our Application of Targeted Predictive Analytics for Data Visualization Services

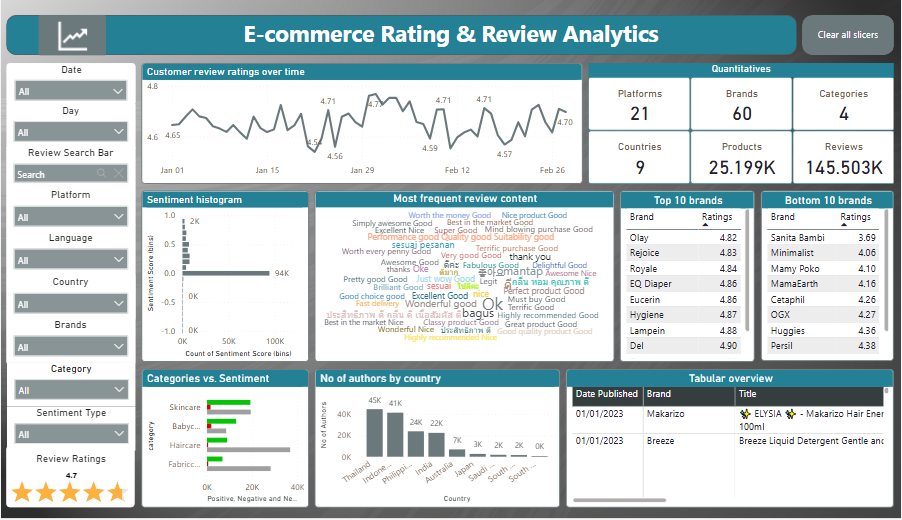
We leverage targeted predictive analytics to transform raw data into dynamic visual insights, enabling businesses to identify trends and make data-driven decisions with confidence. Our advanced data visualization services simplify complex datasets, enhancing clarity and strategic planning.

Customer Targeting

Identifying the appropriate audience is critical for marketing your goods or services. Using the Predictive Analytics tool, you can identify consumer segments most likely to purchase. Tailoring your marketing efforts to these specific groups increases your chances of making successful sales and receiving a great return on investment.

Churn Prevention

Preventing customer churn entails keeping customers and preventing them from leaving. This program uses predictive analytics to monitor customer behavior and identify individuals who are likely to churn. Companies can prevent consumers from leaving by proactively resolving concerns and enhancing customer happiness, resulting in increased customer loyalty.

Sales Forecasting

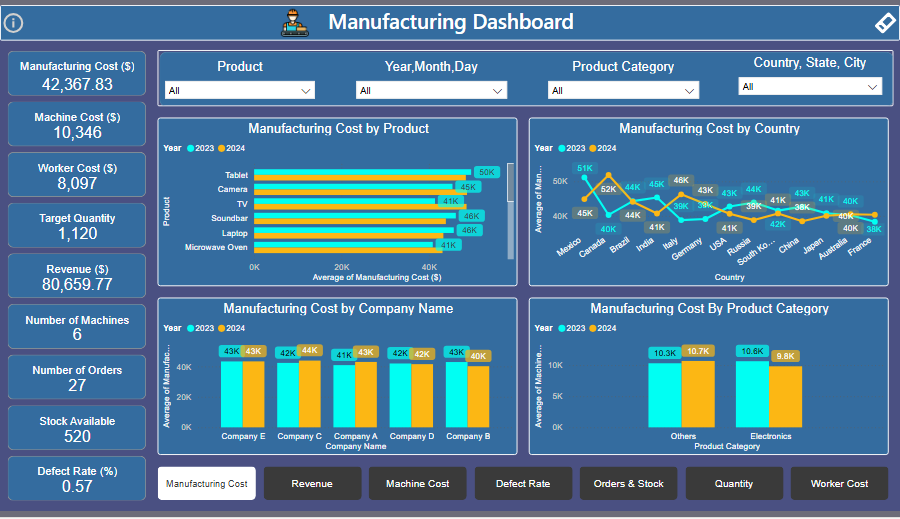
Predictive analytics makes accurate sales projections possible by examining past sales data, market circumstances, and pertinent criteria. This forecasting tool enables firms to predict future sales based on historical data and current market trends, assisting with strategic planning and resource allocation.

Market Analysis

Understanding market conditions and trends is essential for making educated decisions. Your app is critical in assessing industry information and customer behavior to provide insights into market dynamics. Businesses can use this data to identify market opportunities, analyze competition, and develop successful strategies.

Platform & Tech Stack

Specialized tools, technologies, and platforms for cloud migration strategies including rehosting, repackaging, refactoring, retiring, and retaining.

What Creates Our Data Visualization Services Special?

At X-Byte Analytics, we know every business has characteristics that apply to its data. We only provide generic solutions that fit some. Instead, we start by comprehensively understanding your requirements, goals, and data state. An effective data visualization strategy should always match your business objectives.

Strategy

Strategy is considered the most critical aspect of any organization. Our team integrates with clients to understand your data visualization strategies. We create a project strategy to monitor and evaluate your visualization methodologies.

Implementation

We transform raw data into intrinsic and informative graphics to execute effective decision-making processes. Our professionals are skilled in demonstrating market patterns, consumer behavior, and operational efficiency.

Migration

Our expertise assists businesses in staying updated with the changing market scenarios. We provide seamless data migration services without hampering the performance of the solution. Our team focuses on easy migration and integration services to ensure safe data environments.

Data Team as a Service

Understanding market conditions and trends is essential for making educated decisions. Your app is critical in assessing industry information and customer behavior to provide insights into market dynamics. Businesses can use this data to identify market opportunities, analyze competition, and develop successful strategies.

Recognitions and Partnerships

Aws Certified Partner
Trustpilot Certified Xbyte Analytics
Google Cloud Partner Xbyte Analytics
Azure Certified Xbyte Analytics
Provenexpert Xbyte Analytics
Top Developers Section2 Xbyte Analytics
Clutch Certified Xbyte Analytics
Good Firm Xbyte Analytics

Get in Touch

To adopt the latest visualization techniques that increase the value proposition using a universal reporting solution.

Benefits

40%

Data Understanding

There was limited ability to analyze manual consolidation of financial data from multiple sources increased the risk of errors. There were also lack of tools for real-time monitoring of cash flow, analyze financial trends and profitability.

42%

Quick Decisions

Decision-making is facilitated by data visualization consulting services, particularly in time-sensitive industries like business and healthcare.

57%

Error Free

Visualizing data is critical for improved decision-making. When depending exclusively on raw data or textual reports, accurate visualizations help to avoid errors and misunderstandings.