Key Highlights:
- Data storytelling bridges the gap between analytics and action that businesses can understand and act on immediately.
- The best data stories follow a simple framework: start with the right business question, find meaningful patterns, build a clear narrative arc, visualize for impact, and end with specific actions.
- Effective data storytelling accelerates decisions by 3-5x – enabling leaders to grasp complex situations quickly, align stakeholders, and drive measurable outcomes.
Introduction
Most organizations are data-rich but insight-poor.
Companies invest in analytics platforms, hire data teams, and generate reports that nobody acts on. The problem isn’t the quality of the data. It’s that spreadsheets don’t inspire action.
They don’t tell you why something happened, what it means for the business, or what to do next. This is exactly where most teams get stuck.
That’s where data storytelling changes the game.
Data storytelling in data analytics isn’t about making reports look pretty or adding fancy visuals for the sake of it. It’s about turning raw data into something people can actually understand, relate to, and act on. It’s the difference between saying sales dropped by 12% and explaining why it happened, who it affects, and what decision should follow.
In a world where businesses are collecting more data than ever, clarity has become the real competitive advantage.
If you are looking to leverage the competitive advantage of data storytelling in data analytics, then this blog is all you need. Below, we’ll be digging deep into what data storytelling is, data storytelling techniques, how data storytelling improves decision-making, data storytelling examples & beyond.
What is Data Storytelling in Data Analytics?
Data storytelling services in analytics are simply explaining what the data is saying in a way people can actually understand and act on. It’s not about charts, data storytelling tools, or complex models. It’s about clarity.
At its core, good data storytelling answers three basic questions:
- What happened?
- Why did it happen?
- What should we do next?
To make all of this work, data storytelling blends three essential elements:
- Analytical insight – accurate data analysis that reveals what’s actually happening
- Context – explaining why those numbers matter to the business, team, or goal
- Narrative structure – presenting insights in a logical, easy-to-follow flow so people instantly get it
When these three come together, data stops being overwhelming and starts driving decisions. That’s the real power of data storytelling.
At X-Byte Analytics, we help organizations move beyond static dashboards and disconnected reports by designing analytics experiences that lead to action, not just observation. Our work across multiple industries has shown us that the biggest challenge isn’t access to data, but turning it into insights people actually trust and use.
This hands-on experience shapes our approach to data storytelling in analytics, where clarity, relevance, and decision-readiness matter more than complexity or volume. When combined with the right data visualization services, storytelling transforms analytics from a reporting function into a strategic advantage.
“Data are just summaries of thousands of stories; tell a few of those stories to help make the data meaningful.”
— Dan HeathWhy Data Storytelling Matters in Data Analytics for Business Decision-Making?
Data storytelling brings meaning to data by turning analytics into insights people can quickly understand and trust. It helps businesses move beyond what the data shows to what the data means and, most importantly, what to do next.
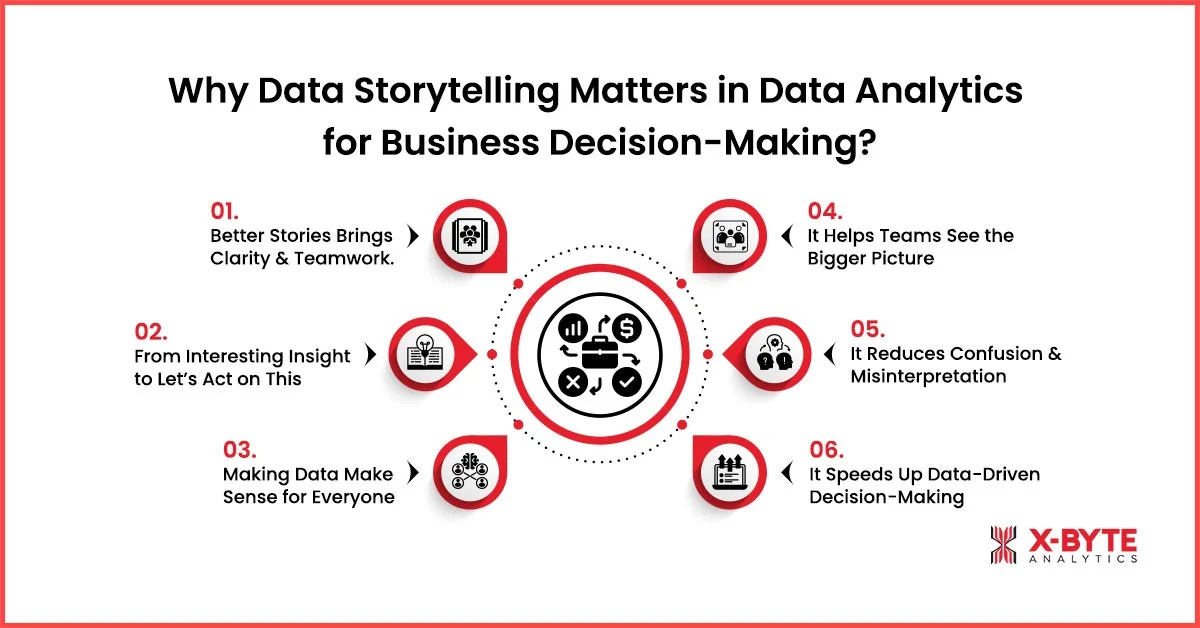
1. Better Stories Brings Clarity & Teamwork.
One of the biggest challenges businesses face is alignment. Different teams look at the same data but walk away with different conclusions.
For example, a leadership team reviewing monthly revenue data may notice a dip and immediately conclude that marketing needs to increase its spending. A data story, however, might reveal that the drop came from delayed shipments in one region, not reduced demand. This is exactly how data storytelling improves decision-making.
2. From Interesting Insight to Let’s Act on This
Many businesses already have business intelligence tools, but the managers end up thinking: Interesting, now what? Data storytelling techniques change that by clearly connecting insights to action.
Take a subscription-based business analyzing churn. Instead of showing churn percentages across months, a strong business intelligence storytelling approach explains that users who don’t complete onboarding within the first three days are 40% more likely to cancel. That story naturally leads to action, improve onboarding, not pricing.
This is the real value of turning data analytics into actionable insights.
3. Making Data Make Sense for Everyone
Not everyone in a business is an analyst, and they don’t need to be. So, another reason why data storytelling matters in data analytics is make everything accessible to non-technical teams by using simple language, context, and narrative visuals. When people understand the story behind the data, they trust it more and act on it faster.
4. It Helps Teams See the Bigger Picture
Data on its own often lives in silos, one metric here, another trend there. Data storytelling connects those dots and shows how different signals relate to each other.
For example, A team notices that fewer users are completing a task. Another report shows people are spending less time on the first step. A data story connects these two signals and explains that early confusion is causing people to drop off before they even get started. Instead of fixing everything, the team knows exactly where to focus.
5. It Reduces Confusion and Misinterpretation
When data is presented without explanation, people fill in the gaps with assumptions. Data storytelling removes ambiguity by guiding people toward the right interpretation.
For example, a sudden spike in activity looks like a win. But the data story reveals that the spike happened right after a one-time notification went out, and activity returned to normal the next day. This prevents the team from assuming long-term improvement and helps them focus on sustainable changes instead.
6. It Speeds Up Data-Driven Decision-Making
When data isn’t clear, people hesitate. They ask for more breakdowns, second opinions, or extra meetings. Data storytelling removes that hesitation by making the insight obvious from the start.
For example, a report shows a sudden change in performance. Instead of reviewing five charts, the data story explains that the change started after a small process update and only affects one specific step. Because the reason is clear, the team can quickly decide whether to reverse the change or adjust it without delays.
Partner With X-Byte Analytics To Build Data Storytelling Frameworks That Convert Analytics Into Real Business Action.
Data Storytelling vs Data Visualization: Key Differences in Analytics and Decision-Making
At first glance, data storytelling and data visualization can look like the same thing. Both use charts, graphs, and visuals. Both aim to make data easier to understand. But their purpose and impact are very different.
Let’s find out more about it:
| Aspect | Data Storytelling | Data Visualization |
| Primary goal | To turn data into clear insights that guide decisions | To visually represent data for easier viewing |
| The core question it answers | What happened, why it happened, and what we should do next | What is happening in the data |
| Role in analytics | Final step that connects analysis to action | Supporting step that helps explore or present data |
| Use of visuals | Uses visuals as part of a broader narrative | Relies entirely on charts, graphs, and dashboards |
| Context provided | Strong business and situational context are always included | Limited or no context unless explained separately |
| Level of interpretation | Low, meaning is clearly guided | High, the viewer must interpret on their own |
| Decision-making impact | High, built specifically for data-driven decision making | Moderate, raises awareness but may not drive action |
| Audience fit | Designed for both technical and non-technical stakeholders | More effective for analytical or data-literate audiences |
| Typical output | Insight-driven narrative supported by data and visuals | Standalone charts, dashboards, or reports |
| Risk if used alone | Minimal, insights are clearly framed | High & can lead to misinterpretation or conflicting conclusions |
| Relation to business outcomes | Direct and it supports analytics-driven insights and actions | Indirect and it requires additional explanation to influence outcomes |
How Data Storytelling Transforms Raw Data into Actionable Insights?
Raw data on its own is just information. It tells you what exists, not what it means. Spreadsheets, dashboards, and charts can show trends, but they don’t automatically tell teams what to do next.
This is why data storytelling matters in data analytics.
Data storytelling transforms raw data into actionable insights by adding meaning, context, and direction, so data doesn’t just inform, it drives decisions.
Step 1: It Cuts Through the Noise
Most dashboards show too much at once. Data storytelling filters the noise and highlights what actually matters.
Instead of reacting to every small change, the story points out the one pattern that keeps repeating. That’s when data stops feeling overwhelming and starts feeling useful.
Step 2: It Explains Why Something Is Happening
Numbers can tell you what changed, but they won’t tell you why. Data storytelling adds that missing layer.
It connects changes in data to timing, behavior, or context, so you’re not guessing or jumping to conclusions. Suddenly, the data feels less random and more logical.
Step 3: It Turns Insight into a Clear Next Step
An insight without action is just an observation. Data storytelling makes the next step obvious.
Instead of saying, This metric dropped, the story explains how that drop affects outcomes and what can be adjusted to fix it. No long debates. No overthinking. Just clarity.
Step 4: It Makes Data Easy to Share and Agree On
When data isn’t explained clearly, everyone interprets it differently. Data storytelling creates one shared understanding.
The same story, told clearly, helps teams align faster and move in the same direction without back-and-forth confusion.
Best Practices for Effective Data Storytelling in Data Analytics
After working with analytics long enough, you realize something important: data doesn’t fail, communication does. Most insights never turn into action, not because the analysis is wrong, but because the story isn’t clear enough to move people.
These are the practices that actually make data storytelling work in real situations, not in theory.
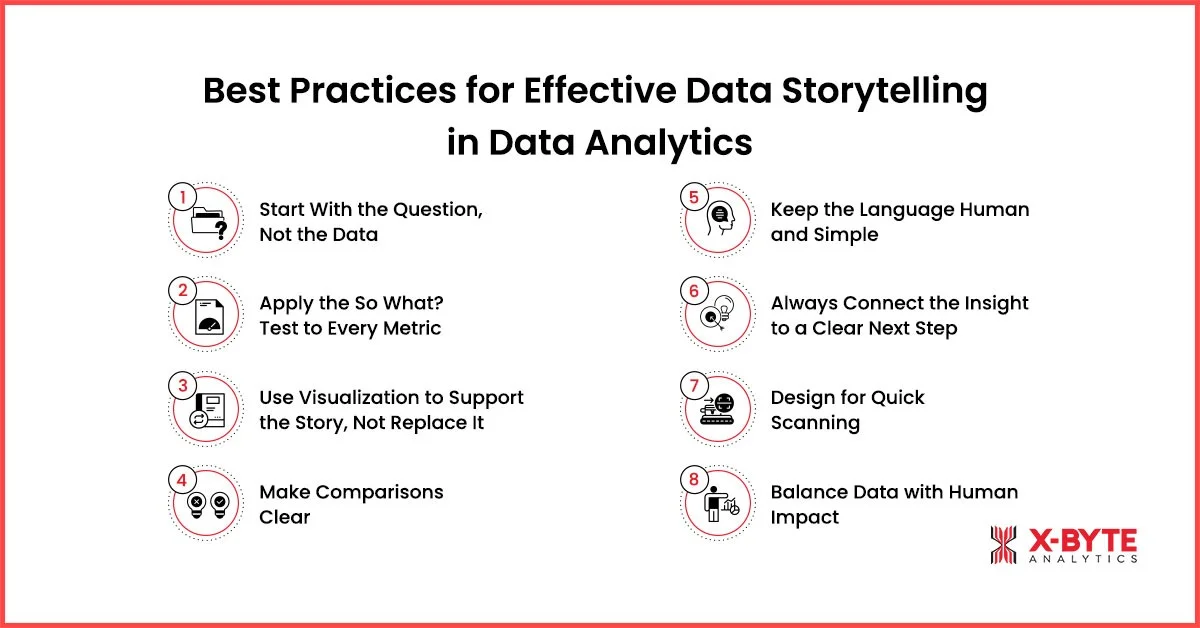
1. Start With the Question, Not the Data
Before opening a dashboard, get clear on why you’re looking at the data. Great data storytelling always begins with a question you’re trying to answer.
Ask yourself:
- What decision needs to be made?
- What problem are we trying to solve?
This keeps your story focused and prevents unnecessary data from distracting the audience. It’s one of the simplest yet most overlooked data storytelling techniques.
2. Apply the So What? Test to Every Metric
Every number must answer one question: so what?
A report says activity increased by 40%. So what?
- Did outcomes improve?
- Did drop-offs increase?
- Did behavior actually change?
For example, instead of saying, This metric dropped, explain when it dropped, what else changed at the same time, and why that matters. This approach strengthens business intelligence services in storytelling and builds trust in the data.
3. Use Visualization to Support the Story, Not Replace It
Charts and graphs are powerful, but they’re only part of the story. Data storytelling and visualization work best when visuals support the narrative, not when they’re expected to speak for themselves.
Use simple, clean visuals that reinforce the key insight. Avoid cluttered charts that force people to interpret instead of understand. Strong narrative data visualization makes insights easier to absorb and remember.
4. Make Comparisons Clear
Numbers need context. A 12% increase means nothing without comparison. Is that good? Compared to what?
Use three comparison types:
- time (vs. last quarter),
- competition (vs. industry average),
- and impact (vs. doing nothing)
Showing acquisition costs rose from $45 to $52 tells one story. Showing they rose while competitors dropped from $60 to $48 tells a more urgent story.
Data storytelling and visualization make these comparisons instant through side-by-side charts and overlapping trends.
5. Keep the Language Human and Simple
If your audience needs an analyst to explain the insight, the story isn’t finished. Effective data storytelling uses simple language that non-technical teams can understand.
Avoid jargon, over-explaining methods, or focusing too much on how the analysis was done. Focus on what it means and why it matters.
6. Always Connect the Insight to a Clear Next Step
An insight only matters if it leads somewhere.
A story that ends with this changed leaves people stuck. A strong data story explains what the change affects and what should happen next. For example, if drop-offs increase at a specific step, the next step becomes obvious; you need to review that step before changing anything else.
This is how teams succeed at turning data analytics into actionable insights. The story doesn’t just inform, it guides action.
7. Design for Quick Scanning
Design for quick scanning. Decision-makers skim dashboards and reports before diving into details.
Use headers that tell the story:
- Revenue declined due to payment failures, not Q4 analysis.
- Highlight key numbers visually, if 73% matters, make it bold and impossible to miss.
- Put the main point in the first sentence of each section.
Someone reading only headers and first sentences should still understand the complete narrative.
8. Balance Data with Human Impact
Pure numbers lack emotional connection. Pure emotion lacks credibility. Turning data analytics into actionable insights requires both.
Here’s an example:
- Start with impact: People keep repeating the same work and losing time.
- Add evidence: Error rates rose from 1.5% to 5.9 in two weeks, mostly at one step.
- Quantify the human cost: That single issue wastes about 30 minutes per person every day, far more powerful than saying productivity dropped by 10%.
Common Data Storytelling Mistakes That Prevent Actionable Insights
Even experienced teams fall into predictable traps that undermine their data storytelling efforts. Avoiding these mistakes makes the difference between insights that sit in inboxes and insights that drive change.
1. Overwhelming with Too Much Data
The most common mistake is showing everything instead of showing what matters.
Teams build dashboards with 20 metrics, 15 charts, and multiple tabs, thinking that more data equals more value. The opposite is true.
Effective data storytelling means less is more. One clear chart showing the 30% revenue drop in the Midwest region drives more action. If the data doesn’t directly answer the core question or support the recommended action, leave it out.
2. Using Visualizations That Mislead
Charts should make things clear, not confusing. Yet businesses often use charts that hide the truth. Starting a revenue chart at $980K instead of $0 makes a 2% increase look huge. Pie charts with 12 tiny slices show nothing clearly. 3D charts just add clutter.
Pick charts that show real scale. When in doubt, simplify. A basic bar chart that shows the truth beats a fancy visualization, any day.
3. Stopping at What Happened
Data teams often explain what happened without saying why it matters or what to do.
Customer complaints went up 25% describes a fact. It’s not a story. Adding context makes it a story.
For example, complaints went up 25% after we changed checkout, specifically about the new verification step. When we tested removing it, complaints dropped 40%.
Business intelligence storytelling answers three things: What happened? Why does it matter? What should we do? Missing any of these leaves people confused about the next steps.
4. Making It About the Data, Not the Decision
Data teams often get so focused on their analysis that they forget the goal, helping leaders make a decision. A 20-slide presentation explaining methodology, statistical tests, and data sources might be thorough. But if the stakeholder still doesn’t know what to do next, it failed.
Data storytelling techniques put the decision first, & 71% of executives prioritize storytelling skills for stakeholder reporting.
Ask yourself: after this presentation, what will the audience do differently? If the answer isn’t clear, rework the story.
5. Using Jargon and Technical Terms
Our multivariate regression shows p-values under 0.05 with a strong R-squared correlation. This is great for data scientists. Confusing for everyone else.
Technical accuracy matters, but clarity matters more. If stakeholders don’t understand, they won’t act. Translate technical findings into clear, concise language that anyone can understand. Save technical details for the appendix or follow-up questions.
6. Ignoring the Story Structure
Data presented randomly confuses people.
But, good data storytelling in data analytics follows a clear structure: problem, analysis, insight, action. Or setup, conflict, resolution. Pick a structure and stick to it.
Start by explaining why this matters, then show what the data reveals, describe its significance, and finally outline the next steps. This logical flow makes stories easy to follow and remember
Best Data Storytelling Examples in Business Analytics
Understanding what good data storytelling looks like helps teams apply these principles. Here are real-world data storytelling examples in business analytics that turned analysis into action.
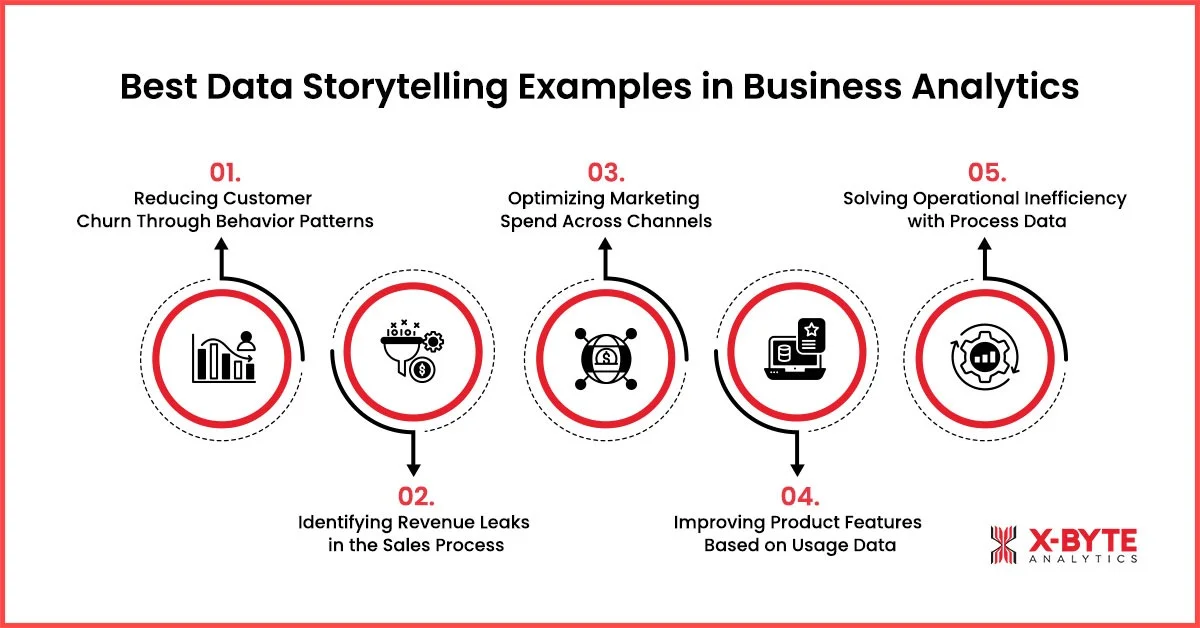
1. Reducing Customer Churn Through Behavior Patterns
A subscription business noticed increasing churn but didn’t know why. The data team could have sent a simple report, churn up 18% this quarter.
Instead, they built a story: They analyzed when customers left and found 65% cancelled within 30 days of signup. Digging deeper, they discovered these customers never completed the onboarding checklist. They visualized the journey, users who completed onboarding had 90% retention, while those who didn’t had only 40%.
The narrative was clear: Incomplete onboarding kills retention.
So, they recommended,
- simplifying the checklist from 8 steps to 3,
- sending reminder emails on day 3 and day 7,
- and add a progress bar showing completion.
Leadership approved the changes immediately. Three months later, 30-day churn dropped by 42%. This is data storytelling in data analytics that drives results, clear problem, clear insight, and clear action.
2. Identifying Revenue Leaks in the Sales Process
A sales team missed quarterly targets but couldn’t pinpoint why. Raw data showed deals moving more slowly, but not the cause.
The analytics team tracked deals through each pipeline stage and found 40% of qualified leads stalled at the proposal stage. They interviewed lost prospects and discovered the proposal template was 25 pages long, confusing, and required legal review.
They presented this with simple data storytelling and visualization, a funnel chart showing the proposal stage bottleneck, competitor comparison showing their proposals were 3x longer than industry standard, and win rate data showing simplified proposals closed 60% faster.
The story led to action: redesign the proposal to 6 pages, add a pricing calculator, and create pre-approved legal language. Next quarter, win rates improved 28%, and the sales cycle was shortened by 12 days.
3. Optimizing Marketing Spend Across Channels
A marketing director had a budget spread across five channels but no clear picture of what worked. Monthly reports showed metrics for each channel, but no story.
The data team calculated customer lifetime value by acquisition channel and found email subscribers had 4x higher value than social media followers. They showed that 60% of the budget went to social, with 20% of results, while email got 15% of the budget but drove 45% of revenue.
Using narrative data visualization, they created a simple chart comparing cost per acquisition, conversion rate, and lifetime value side by side for each channel. The imbalance was obvious.
The recommendation was specific: shift 30% of the social budget to email marketing, launch a lead magnet campaign to grow the email list, and test two new email sequences for engaged subscribers.
Result: customer acquisition cost dropped 35% while overall conversions increased 22%. Same budget, better story, smarter allocation.
4. Improving Product Features Based on Usage Data
A product team wanted to add new features but had limited development resources. They could build three features, but had requests for fifteen.
Data storytelling techniques helped in analyzing that users who adopted three specific features within the first week had 85% retention versus 40% for those who didn’t.
They presented this as a clear story: instead of building new features, double down on getting users to discover these high-value features faster. And, moving just 20% more users to adopt these features would increase annual revenue by $1.8M. The visualization showed user journeys, highlighting where people discovered these features versus where they missed them.
The recommendation: redesign onboarding to showcase these features, add in-app prompts, and create tutorial videos.
Results: Six months later, feature adoption increased 45% and retention improved accordingly.
5. Solving Operational Inefficiency with Process Data
An operations manager knew the fulfillment process was slow, but couldn’t identify the bottleneck.
The data team analyzed each process step & found out that 70% of delays happened at quality inspection, not because inspection took longer, but because inspectors were only scheduled during business hours, while orders came in 24/7.
They visualized this with a timeline showing when orders arrived versus when they got inspected. They calculated the cost; each hour of delay reduced customer satisfaction scores and increased support tickets.
The story led to a clear solution: add one inspector on the evening shift and one on the weekend shift. It costs $120K annually. The benefit was to reduce processing time by 40%, improve satisfaction scores, and cut support costs by $200K.
Unlock Actionable Insights With Expert Data Visualization And Business Intelligence Storytelling Designed For Faster, Smarter Decisions.
Final Thoughts!
Data without a story is just noise. A story without data is just opinion. But when combined effectively, it becomes powerful and brings clarity that drives action.
The organizations winning today aren’t those with the most data; they’re the ones telling the best stories with it.
At X-Byte Analytics, we help businesses turn complex data into clear, actionable insights that drive results. Our team specializes in creating data storytelling frameworks tailored to your stakeholders, building visualizations that communicate instantly, and developing analytics strategies that align with your business goals.
Whether you need comprehensive data analytics consulting services to unlock hidden patterns in your data or expert data visualization services to transform reports into compelling narratives, we partner with you to make your data work harder.