Key Highlights:
- Data cleaning in Power BI ensures accurate finance reporting by fixing data types, duplicates, and structural errors before analysis.
- Most reporting issues originate from poor source data and lack of a proper data quality framework, not the dashboard itself.
- A phased approach with Power Query, validation gates, and governance creates a single, reliable financial truth.
Your dashboard looks great. The numbers are wrong.
That is the most expensive problem in mid-market finance today. Not missing data. Not the wrong tool. Wrong numbers that look right. And the leadership team is making budget decisions on them.
Data cleaning in Power BI is not an IT task. It is a finance leadership problem. Every month that passes without a structured Power BI data quality framework adds to a growing trust deficit that no new dashboard or visualisation layer can fix.
This guide is built for finance leaders, data heads, and operations teams who are done tolerating reports that do not reconcile. It covers what data cleaning in Power BI actually means for finance functions, where the failures originate, how to fix them in sequence, and why most organisations get the structural layer wrong the first time.
What Is Data Cleaning in Power BI?
Data cleaning in Power BI is the process of identifying and correcting structural errors, data type mismatches, duplicate records, null values, and unstandardised field definitions in your source data before and during transformation.
For finance teams specifically, it means one thing: every calculated measure and every financial dashboard your leadership relies on must reflect a single auditable version of financial truth, not three competing versions that require manual verification before every board meeting. Not three versions. Not two versions that almost match. Just one.
The engine that handles data cleaning in Power BI is Power Query. Every transformation step you apply is recorded, applied automatically on every refresh, and traceable back to the source. Following Power Query best practices for finance means treating that, applied steps panel not as a technical log but as a governance document. In finance environments approaching compliance review, investor reporting, or audit readiness, that traceability is the difference between a defensible number and one nobody can explain.
But here is what most guides will not tell you: Power Query is only as effective as the decisions made before data reaches it. And that is exactly where finance data quality breaks down at scale.
Why Your Finance Data Is Already Broken Before Power BI Opens
Most data cleaning guides start inside Power BI. That is the wrong starting point.
Finance data does not become messy inside the tool. It arrives that way. The origin of almost every reporting discrepancy in a finance Power BI environment is upstream of the transformation layer. Investigating the dashboard first wastes hours that most finance teams cannot afford at month close.
The sources are predictable and almost always traceable to decisions made at the source system level:
- ERP exports that silently change column structure between system updates
- Currency and revenue fields stored as text rather than decimal numbers
- Date fields formatted inconsistently across consolidated data sources
- Duplicate transaction records generated by integrations without deduplication logic
- Null values in cost centre and entity fields that cause measures to aggregate incorrectly
- Manual journal entries introducing freetext into fields designed for standardised codes
- Non-unique keys in lookup tables that cause Power BI relationships to produce incorrect cross-filter results
The result is not a broken visual. The result is a board meeting where three people have three different revenue figures from the same power bi finance dashboard, and nobody in the room can explain which figure is correct. That is not a visualisation problem. That is a structural problem that begins before a single query runs.
Why This Matters to Your Business
When finance data arrives dirty, every downstream decision carries the error forward. Leadership loses confidence in the reporting environment. Finance heads build parallel spreadsheets to verify what the dashboard should already be confirming. Month close becomes a reconciliation exercise rather than an analytical one. In mid-market finance environments, this pattern consumes 30 to 40 percent of monthly close time without producing a single insight.
The organisations that resolve this do not invest in better visuals. They fix the Power BI data quality framework every visual sits on.
Is your finance team still reconciling figures manually at month close? That gap is structural, not technical. X Byte Analytics can identify exactly where your data breaks down.
Old Way vs. New Way: The Finance Data Cleaning Shift
| Dimension | Old Way | With a Power BI Data Quality Framework |
| Where cleaning starts | Inside Power BI after data is loaded | Before data enters Power BI at the source |
| Error detection timing | Discovered in board meetings | Caught at validation gates before refresh |
| Data type management | Auto-detected by Power BI, often wrong | Defined explicitly in Power Query per field |
| Duplicate handling | Manual review after reports are published | Documented deduplication rule at every refresh |
| Automated financial reconciliation | Non-existent, manual spreadsheet checks | Built into ETL pipeline as a scheduled validation |
| Measure validation | Eyeballed against prior period | Reconciled against a verified control total |
| Power BI data governance ownership | Assumed to be IT responsibility | Named boundary between finance rules and data pipeline |
| Audit trail | Non-existent or informal | Applied Steps in Power Query as a documented record |
| Monthly close reconciliation time | 30 to 40 percent of close cycle | Reduced to analytical review, not data verification |
| Executive confidence in reports | Declining, parallel spreadsheets maintained | Single version of financial truth, no shadow trackers |
How Data Cleaning in Power BI Works: Behind the Scenes
Understanding the mechanics clarifies why sequence matters. Most finance reporting failures originate at the transformation layer, not the visualisation layer where teams typically begin investigating.
You load a revenue extract from your ERP. Power BI opens Power Query automatically.
You see the data. What Power BI sees is different. It scans the first 1,000 rows to detect data types. If your revenue field has been exported as text from the source system, Power BI detects it as text and proceeds without warning. Every DAX measure you build on that field returns an incorrect result. No error. No flag. Just a wrong number that looks right.
You build a month over month comparison. The time intelligence function runs.
But your date field carries two formats across consolidated sources. Some records read as MM/DD/YYYY and others as DD/MM/YYYY. Power BI cannot resolve the ambiguity. Your month over month comparison measures different things in different rows and presents the result as a single coherent figure.
You publish the report. Leadership uses it for the quarterly review.
Three weeks later, someone compares it to the general ledger. The numbers do not match. The investigation begins at the dashboard, moves to the measures, eventually reaches the transformation layer, and finally arrives at the source export that was wrong from day one. Every hour spent investigating was avoidable.
This is not an edge case. It is the standard pattern in finance environments where Power Query best practices for finance have not been applied structurally. Building DAX measures for finance accuracy is a separate challenge entirely, but it starts here — with clean, correctly typed, validated source data.
Still Reconciling Numbers Manually? Build a Power BI Data Foundation You Can Actually Trust
How to Automate Data Cleaning in Power BI for Monthly Reports
Before walking through the phases, this is the question most finance leaders eventually ask: can this be automated so it does not require manual intervention every month?
The answer is yes, partially. Power Query transformation steps run automatically on every scheduled refresh once they are built. That is the first layer of automated data cleaning in Power BI. The steps you define once, data type corrections, null replacements, deduplication rules, column renaming, apply without human input on every subsequent refresh.
But automated financial reconciliation requires a second layer. Transformation automation handles structural cleaning. It does not validate whether the data arriving from your source system is correct before cleaning begins. For that, you need ETL validation gates built into the pipeline using Power Query M Code or a data orchestration tool that tests source data against business rules before the refresh triggers.
Think of it this way: Power Query automates the cleaning. M Code and ETL validation gates automate the quality check that confirms there is something worth cleaning.
In mid-market finance environments without a dedicated data engineering function, partial automation through Power Query is achievable immediately. Full automated financial reconciliation with pre-load validation gates typically requires a structured implementation. The phases below cover both layers. For a deeper look at how M Code powers advanced transformation logic, that is covered in our guide to Power Query best practices for finance teams.
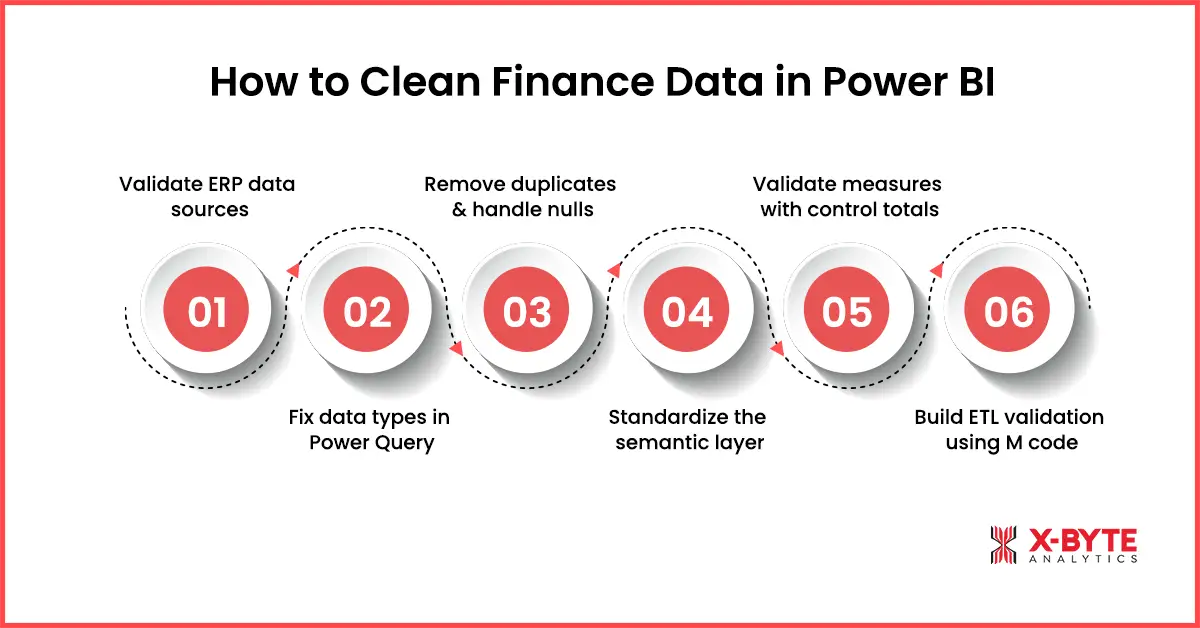
How to Clean Finance Data in Power BI: A Phase by Phase Process
Effective data cleaning follows a defined sequence. The order is not optional. Teams that address cosmetic issues before structural failures invest time optimising the surface of a report that is already returning incorrect data.
Can your team execute these phases consistently across every refresh cycle? Most mid-market teams cannot. Book a scoped call with X Byte Analytics and get a clear answer in one session.
Phase 1: Validate ERP Sources
Before Power Query opens, your source extract must pass three checks.
Confirm row counts. Compare the number of records in the extract against the expected count from the prior period and a manually verified control total. A deviation beyond your defined threshold triggers a hold on the load.
Reconcile aggregate totals. The sum of key financial fields in the raw extract must match the corresponding total in the source system. Revenue, cost, and balance figures are reconciled at the field level before a single Power Query transformation step runs.
Confirm the date range. The earliest and latest date values in the extract must cover the correct reporting period. A scheduled refresh job can complete with a success status while delivering data from the wrong period. This gate catches it before the report is published.
Most finance teams skip Phase 1 entirely and wonder why their numbers never reconcile. Executing it consistently across every refresh cycle requires a defined process and named ownership. It is not a one-person task. It is an organisational capability. And it is the foundation of any working Power BI data quality framework.
Phase 2: Fix Data Types in Power Query
Open the Power Query Editor via Transform Data. Every financial field must be assigned its correct data type explicitly. Do not trust Power BI auto-detection.
Revenue, cost, and balance fields: Set to Decimal Number. Confirm no text values, currency symbols, or formatting characters will cause the type assignment to fail silently.
Date fields: Set to Date. Mixed date formats across consolidated sources must be resolved using a consistent M Code transformation step before the type is assigned.
Category and dimension fields: Set to Text. Trim whitespace using the Format options in the Transform tab. A field that appears identical in two tables but carries a trailing space in one will cause a relationship failure that is extremely difficult to diagnose after the model is built.
Apply type corrections before any calculated column or measure references those fields. This is the most consistently underestimated sequencing mistake in finance Power BI implementations and the single most common root cause of silent DAX calculation failures.
Phase 3: Remove Duplicates and Define Null Rules
Select the column or combination of columns that define a unique record. Apply Remove Duplicates under the Home tab. Document the deduplication rule in the query description so it applies consistently across every future refresh.
For null values in dimension fields, use Replace Values to substitute nulls with an agreed placeholder such as Unallocated. In numeric fields, define whether nulls should be treated as zero or excluded from aggregations. The rule must be documented, repeatable, and owned by someone with the authority to change it. Without ownership, the rule drifts between refresh cycles and reconciliation problems return within two reporting periods.
Phase 4: Standardise the Semantic Layer
Rename all columns using a consistent naming convention before data is loaded into the Power BI semantic model. Apply consistent text casing to categorical values. When a field called Net Revenue in one report is called Revenue Net of Returns in another, users cannot determine whether they are looking at the same figure.
Standardise measure definitions across all reports. A revenue measure that filters by posting date in one department report and by transaction date in another produces two figures from the same underlying data. Leadership sees a discrepancy. The finance team spends two days investigating a Power BI data governance gap rather than a calculation error.
This is where most organisations realise the problem is larger than a Power Query fix. Semantic layer standards are a finance leadership decision. Technical teams can implement them. They cannot define the business rules. That boundary is where most mid-market data quality programmes stall.
Phase 5: Validate Measures Against Control Totals
After the model is built, every key financial measure must be compared against a manually verified control total from the source system for the current period and at least one historical period.
This step confirms that the transformation and model structure have not introduced errors between data cleaning and report publication. Run this validation before the report enters production. Run it again after any structural change to the model or source system. A measure that passed validation six months ago may fail silently after an ERP update changed a field format without alerting the data team.
Phase 6: Build ETL Validation Gates Using M Code
Data cleaning is not a one-time event. Every refresh introduces the possibility of new errors. ETL validation gates are defined checkpoints where M Code tests data against business rules before it reaches the Power BI semantic model. A refresh job that completes with a success status is not the same as a refresh job that delivers correct data.
In Power Query, M Code can be written to test whether incoming row counts fall within an expected range, whether aggregate totals reconcile against a reference value, and whether required fields contain no unexpected nulls before the transformation proceeds. When a gate fails, the refresh is halted and an alert is triggered. This is the technical engine behind automated financial reconciliation in Power BI environments.
Building these gates requires M Code capability and defined business rules for each checkpoint. In environments where that capability does not exist internally, the gates do not get built, errors continue to pass through on every refresh, and the reconciliation problem never resolves regardless of how many times the dashboards are rebuilt. This is where structured power bi development determines whether your data pipeline holds at scale or breaks silently every reporting cycle.
Power BI Data Governance: Why the Technical Fix Is Never Enough
This is the section most guides skip entirely. And it is the reason most data cleaning implementations eventually fail.
Power BI data governance is the set of decisions, ownership boundaries, and standards that determine whether your data quality holds across refresh cycles, team changes, and system updates. Without it, every technical fix you apply today becomes a new discrepancy six months from now.
The governance failure pattern in mid-market organisations is consistent. Finance assumes the data team has validated the business logic. The data team assumes finance has signed off on field definitions. Neither has. Data quality issues persist for months because nobody owns the boundary between business rules and pipeline integrity.
The resolution is a named ownership model. Finance owns business rules and field definitions. Data teams own pipeline integrity and model structure. That boundary, documented and enforced, resolves persistent data quality stalls that purely technical interventions cannot fix.
Power BI data governance also determines audit trail integrity. When data cleaning in Power BI is applied with documented transformation logic and ETL validation gates, the Applied Steps panel becomes a repeatable audit record. For US mid-market companies approaching Series B, SOX readiness, or FP and A maturity assessments, that record is not optional.
How Do I Know If My Power BI Data Quality Problem Is Structural?
How do I automate data cleaning in Power BI for monthly reports?
Start with Power Query. Every transformation step you build runs automatically on every scheduled refresh. That covers structural cleaning. For automated financial reconciliation, add M Code validation logic or an orchestration layer that tests source data against business rules before the refresh triggers. If your team does not have M Code capability, that is the first gap to address. The automation exists. The implementation requires a defined process and technical ownership.
What is the difference between Power BI data cleaning and Excel Power Query?
The engine is the same. Power Query in Excel and Power Query in Power BI use identical M Code syntax and the same transformation interface. The difference is scope and governance. Excel Power Query cleans data for a single workbook used by one person. Power BI Power Query cleans data for a semantic model used by an entire organisation across multiple reports, departments, and refresh cycles. The technical steps are transferable. The governance requirements, validation logic, and ETL pipeline standards are not. What works as a manual Excel process breaks immediately when applied at organisational scale in Power BI without a supporting data governance structure.
The Severity Sequencing Model: Fix in This Order
Not all data quality issues carry the same business cost. Here is the correct prioritisation for finance environments.
Severity One: Silent Calculated Measure Failures Data type errors that produce wrong results with no visible error. Resolve first, always.
Severity Two: Duplicate and Missing Records Overstated revenue figures and underreported costs that do not reconcile against the general ledger.
Severity Three: Relationship and Key Integrity Failures Non-unique keys and null values in relationship fields that cause Power BI to aggregate across the wrong dimension members.
Severity Four: Semantic Inconsistency Different field names and measure definitions for the same financial concept across reports and departments. This is a Power BI data governance failure before it is a technical one.
Severity Five: Cosmetic and Formatting Issues Display formatting and column naming that affects usability but does not corrupt calculated results.
Teams that address Severity Five before Severity One are investing time in the appearance of a report that is already delivering incorrect data.
Turn Unreliable Finance Reports Into Accurate, Audit-Ready Insights With a Structured Data Framework
Is Your Finance Reporting Built on a Broken Foundation?
If you recognise your organisation in the patterns described above, this is the right point to assess the foundation before scaling the reporting environment further.
The team at X Byte Analytics provides power bi consulting for mid-market finance and data teams who need to resolve data quality at the structural layer, not just at the dashboard surface. That means source system reconciliation before the first query runs, ETL validation gates built into the refresh pipeline using M Code, Power BI data governance defined at the finance leadership level, and automated financial reconciliation validated against control totals before any report enters production.
The result is not a better dashboard. It is a reporting environment that leadership trusts enough to act on without verification.
If your finance team is currently experiencing any of the following, the structural layer is where the problem sits:
- Power BI figures that do not reconcile against your ERP or general ledger
- Inconsistent numbers across departments using the same report
- Month close reconciliation consuming more than 20 percent of your close cycle
- Leadership questioning figures in board meetings rather than acting on them
- Finance heads maintaining personal spreadsheets to verify Power BI outputs
Book a scoped assessment call with X Byte Analytics. A direct conversation about where your specific data foundation is failing and what it takes to fix it permanently.
Not ready for a call yet? Download the Finance Data Quality Checklist and run your own reconciliation exercise before your next month close.