Strengthen your sales operations with a dashboard built to show exactly what drives conversions, deals, and revenue. Our Power BI CRM & Lead Analytics Dashboard transforms raw CRM data into clear insights, helping sales teams focus on high-value opportunities, improve win rates, and forecast growth with confidence.
Designed for performance-oriented sales organizations, this dashboard gives leaders visibility into lead behavior, agent efficiency, product profitability, and pipeline health—without switching between multiple systems or spreadsheets.


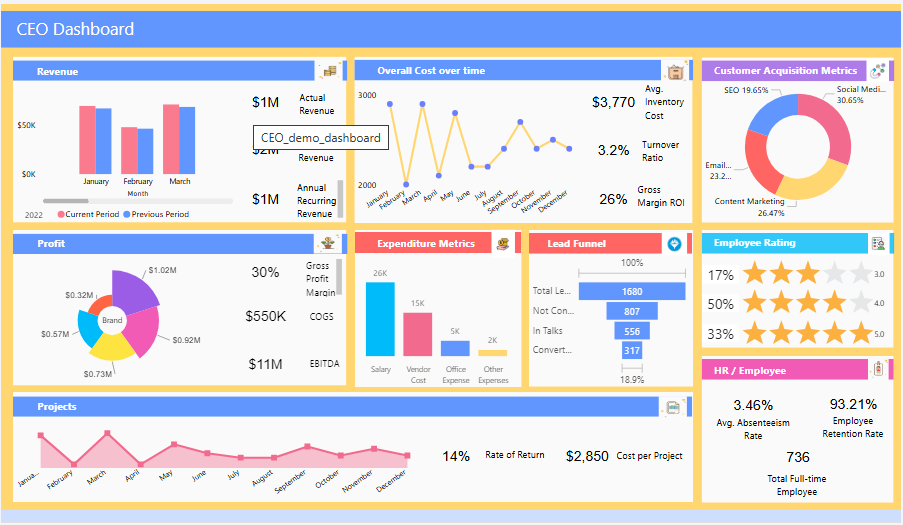
A Power BI CRM & Lead Analytics Dashboard brings together data from your CRM, marketing tools, sales activity trackers, and product systems into a unified analytical layer. Instead of scattered reports, teams get a consolidated view of leads, opportunities, revenue trends, discounts, and agent performance.
With our Power BI CRM dashboard services, businesses gain the ability to evaluate every touchpoint in the sales cycle—from lead acquisition to deal closure. Automated signals identify stalled deals, low-quality pipelines, pricing issues, and declining win rates early. Leadership can finally act on accurate, real-time sales intelligence.
See how your CRM processes translate into measurable performance.
Our Power BI CRM Dashboard delivers interactive visualizations that reveal deal movement, regional performance, product profitability, and team efficiency—helping sales teams prioritize the actions that genuinely move revenue forward.
Our CRM Analytics Dashboard highlights the most impactful CRM KPIs that give leaders a clear view of revenue performance, pipeline movement, and sales productivity. These insights help teams strengthen conversions, forecast accurately, and maintain a consistently healthy sales cycle.
This CRM Dashboard brings together all critical sales insights into one unified view, enabling teams to understand pipeline movement, agent productivity, and revenue drivers with greater accuracy. It helps leaders forecast confidently and optimize performance across every stage of the sales cycle
For companies improving their data foundation, this dashboard can be further strengthened with Data Strategy Consulting Services.

Designed for teams that require greater clarity and control over their sales funnel, from lead generation to deal closure. It helps identify growth opportunities, minimize risk, and improve collaboration across sales, marketing, and revenue operations.
Turn your CRM data into a strategic advantage with a custom Power BI dashboard built for high-performance sales teams.

Sales teams today manage high volumes of leads, short buying cycles, price-sensitive prospects, and competitive deals. Without unified visibility, decision-making suffers and forecasting becomes guesswork.
A Power BI CRM Dashboard removes ambiguity from the sales process. It highlights the strongest opportunities, exposes weak points, and provides a roadmap to consistent revenue performance.

This dashboard empowers sales teams with real-time visibility into deal progress, revenue trends, and team performance. With clear insights into opportunities, pricing behavior, and pipeline health, organizations can make faster, data-driven decisions that improve conversions and drive predictable revenue growth.

Identify stalled deals early and maintain momentum across the pipeline.

Understand what influences successful deals and replicate winning patterns.

Use real-time visuals to refine quarterly targets and performance strategies.

Detect discount patterns and safeguard profitability across product lines.

Use transparent metrics to develop, coach, and motivate the sales team.

Apply predictive scoring and weighted pipelines for reliable revenue projections.

Prioritize high-performing regions and industries to allocate resources effectively.

Quickly identify deals at risk and prevent end-of-quarter surprises.
Empower your sales team with a data-driven CRM dashboard that accelerates performance and drives revenue predictability.

Result:
28% pipeline success rate
22% Faster Alert Resolution Time

Result:

Result:
40% Decrease in Approval Time
25% Accuracy in Credit Score
X-Byte Analytics builds performance-focused CRM dashboards designed for clarity, scalability, and revenue impact. Our solutions provide the intelligence sales organizations need to make confident decisions and outperform targets.

Every dashboard is structured around your most important CRM KPIs—revenue trends, win rates, pipeline stages, and agent performance.

We streamline and unify CRM, lead, product, and marketing data into a clean, high-quality dataset.

Tailored dashboards for sales agents, managers, directors, revenue leaders, and executives.

Machine learning models identify deal probabilities, conversion likelihood, and risk factors.

Compatible with major CRM tools—Salesforce, HubSpot, Zoho, Dynamics, and more.

We provide ongoing enhancements, KPI updates, and insights as your sales operations evolve.