RTO Data Analysis Dashboard: Unlocking Insights for the Automotive Industry
- Home
- Case-Study
- RTO Data Analysis Dashboard for Automotive Industry
Project category
RTO Data Analysis Dashboard
Automotive
Germany
5 Months
Looking to gain real-time visibility into student performance, attendance risks, and academic outcomes?

Project Overview
A leading car dealer in Germany faced challenges in managing and analyzing large volumes of vehicle registration data across various jurisdictions. With multiple data sources, gaining a unified view of market trends, sales performance, and regional growth patterns was increasingly difficult. Without real-time visibility, it became a struggle to optimize operations, monitor year-over-year growth, and assess market share dynamics effectively.
To overcome these challenges, an RTO Data Analysis Dashboard was developed using Power BI. This dashboard consolidated all RTO-related data into a single, interactive platform, providing decision-makers with real-time insights into vehicle registrations, sales growth, and regional performance.
Key KPIs Tracked
The RTO Data Analysis Dashboard tracks critical KPIs to provide actionable insights into vehicle registration and sales performance. These KPIs enable automotive agencies, manufacturers, and local governments to make informed decisions:
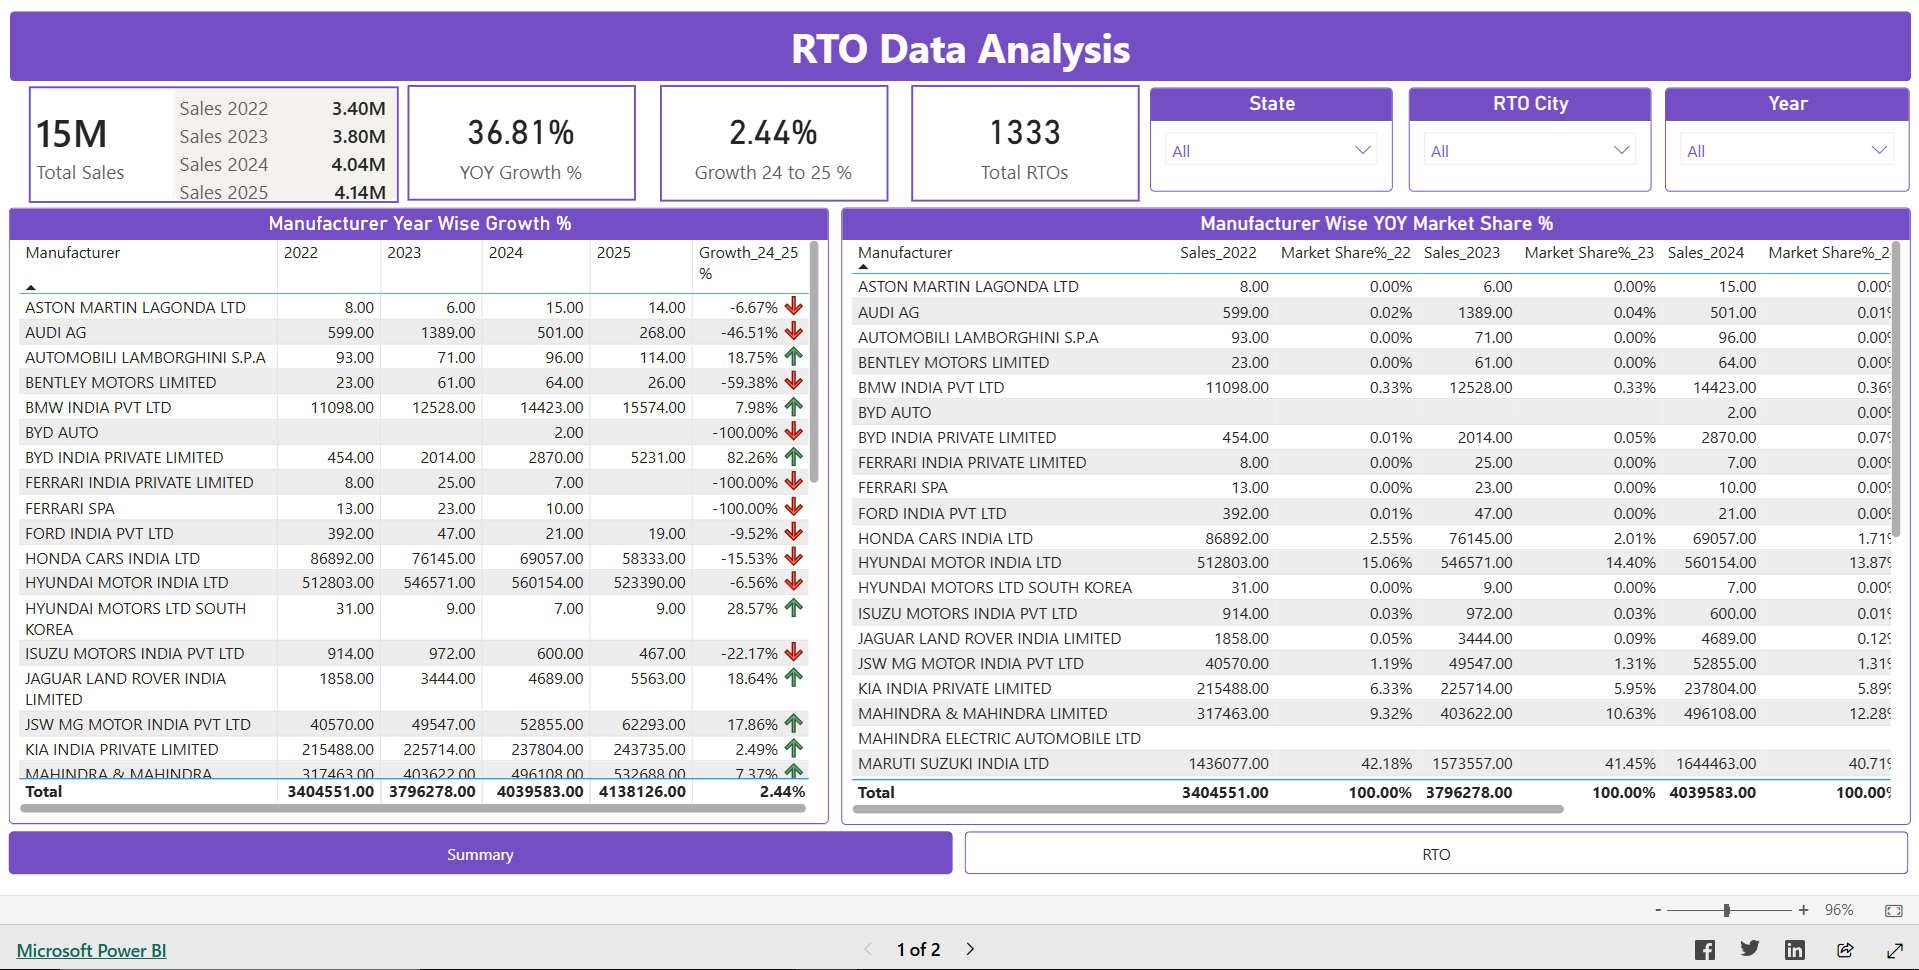
- Total Vehicle Registrations - Measures the total number of vehicles registered across the region, helping assess vehicle ownership and demand.
- YoY Sales Growth - Tracks year-over-year sales growth, highlighting the expansion or contraction of the vehicle registration market.
- Total Registration Authorities Covered - Indicates the number of authorities or regions involved in the registration process, enabling performance comparisons across jurisdictions.
- Year-wise Market Share - Tracks market share for the vehicle registration industry, offering insights into competitive positioning and overall performance.
- Manufacturer-wise Sales - Breaks down vehicle registrations by manufacturer, helping identify dominant brands and growth opportunities.
- Manufacturer Growth - Measures the growth rate for each manufacturer, helping identify rising brands and those losing market share.
- State-wise Growth - Provides growth data for vehicle registrations at the state level, enabling detailed geographic analysis and expansion planning.
- Registration Authority Productivity - Tracks vehicle registrations processed per authority, offering insights into operational efficiency and regional demand.
- Sales MOM (Month-over-Month) - Measures monthly sales fluctuations, providing a quick snapshot of short-term trends.
- Sales YOY (Year-over-Year) - Tracks annual sales growth or decline, providing a comprehensive view of yearly performance.
Solution Delivered – RTO Data Analytics with Power BI
The RTO Data Analysis Dashboard was developed with a robust technology stack to ensure data accuracy, scalability, and real-time updates. The solution was structured as follows:
Data Integration
We integrated vehicle registration, sales, and market data from various sources. Apache Kafka enabled real-time streaming, while Google BigQuery processed data to ensure smooth integration and consistent quality.

Trend & Performance Analysis
Using Power BI, we visualized key trends in sales and registrations. Python automated advanced data analysis, helping identify risks and growth opportunities.

Interactive Dashboard Design
The Power BI dashboard provided user-friendly, role-specific views, allowing stakeholders to access actionable insights with easy-to-use filters.

Real-Time Updates
Automated data refreshes ensured that the dashboard always displayed the most current data and performance indicators in real-time.

Collaborative Reporting
Reports generated by Power BI were easily shareable, promoting collaboration across teams and improving decision-making through Python-powered automation.

Core Features of the Dashboard
The RTO Data Analysis Dashboard transforms complex vehicle registration and sales data into clear insights, empowering decision-makers to optimize operations and assess market performance:
Why Automotive Agencies & Manufacturers Need an RTO Data Analysis Dashboard
An RTO Data Analysis Dashboard allows automotive agencies, manufacturers, and government authorities to shift from reactive reporting to proactive decision-making, with real-time insights that enhance operational efficiency and strategic planning.
01
Proactive Market Analysis
Early identification of at-risk students enables timely academic and counseling support.
02
Enhanced Operational Efficiency
Monitor registration authority productivity and streamline operations for faster processing and higher accuracy.
Data-Driven Decision-Making
Enable leadership to make informed decisions based on real-time data, eliminating the need for manual reports.
04
Competitive Intelligence
Track manufacturer performance and market share to spot growth opportunities or competitive threats.
05
Faster Expansion Planning
Use state-level growth insights to identify regions with the highest potential for expansion.
06
Improved Resource Allocation
Optimize resource distribution by identifying high-performing regions and manufacturers, ensuring a strategic focus where it’s most needed.
Who Gains Actionable Insights from This Dashboard?
Technology Stack
The RTO Data Analysis Dashboard utilizes a powerful technology stack to ensure accuracy, scalability, and actionable insights:
Power BI

Apache Kafka

Python
Results Achieved
After implementing the RTO Data Analysis Dashboard, the car dealer experienced notable improvements in data visibility, decision-making, and operational efficiency:
Key Results:
In conclusion, the RTO Dashboard empowered the company with real-time, data-driven insights, optimizing performance and operational efficiency across its network.