Optimizing Operations for a German-Based Manufacturing Company
- Home
- Case-Study
- Optimizing Operations for a German-Based Manufacturing Company
Project category
Data Analysis Dashboard for Manufacturing company
Kraftwerk Industrial Systems GmbH
Germany
3 months
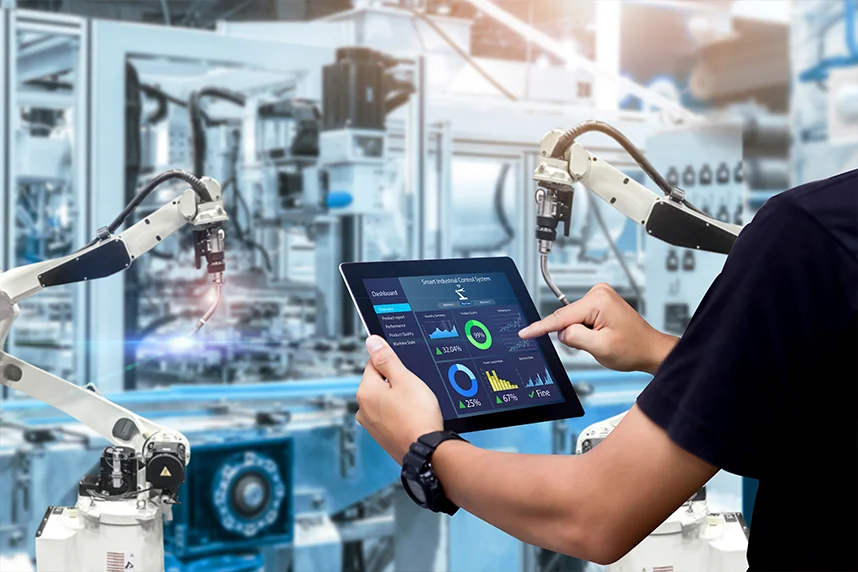
Transform Your Manufacturing Operations with Real-Time Insights
Project Overview
A leading Germany-based electronics manufacturer serving consumer, automotive, and industrial markets was experiencing rising production costs, elevated defect rates, fragmented order/stock processes, and sluggish revenue growth.
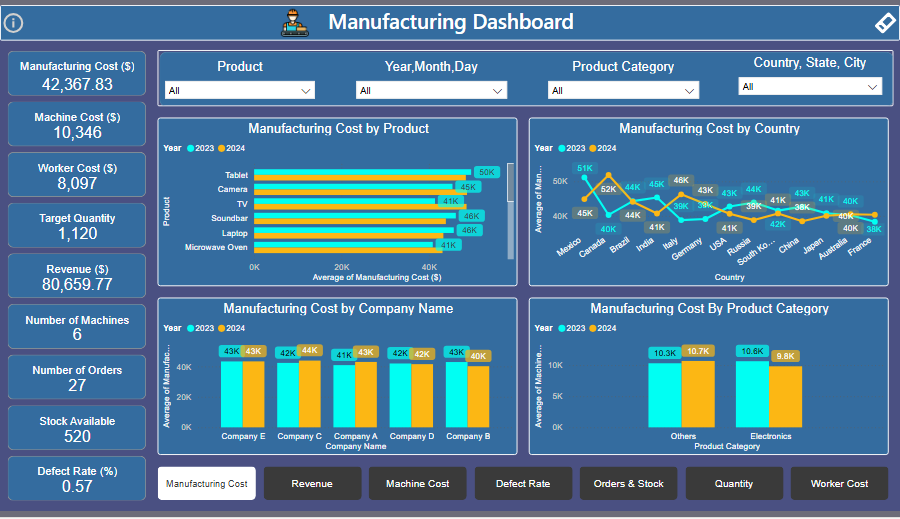
We deployed a centralized Manufacturing Operations Dashboard in Power BI to unify ERP/MES/QMS/WMS data, add near real-time monitoring, and drive cost, quality, and throughput improvements across plants and product lines.
Key KPI’s to Track
These KPIs provide a unified view of manufacturing performance across cost, quality, efficiency, inventory, workforce, reliability, sustainability, and financial governance. Together, they enable real-time visibility, faster root-cause analysis, and data-driven decision-making across plant-floor and executive teams.
- Cost & Throughput: Unit cost, cost variance (material/labor/overhead), throughput, cycle time, takt time
- Quality: First Pass Yield (FPY), defect rate/PPM, scrap & rework %, customer returns/RMA rate
- Efficiency & Capacity: OEE (availability, performance, quality), capacity utilization, changeover time
- Inventory & Fulfillment: Inventory turnover, stockouts/backorders, days of cover, on-time in-full (OTIF)
- Labor & Workforce: Labor utilization, overtime %, absenteeism, training compliance
- Revenue & Margin: Product/category revenue, contribution margin, promo/discount impact
- Maintenance & Reliability — Tracks asset health, downtime, and failure risks to ensure uninterrupted production and lower maintenance costs.
- Energy & Sustainability — Monitors energy usage, emissions, and waste to drive cost-efficient and environmentally compliant manufacturing.
- Supplier & Financial Governance Depth — Measures supplier performance, cost control, and cash flow to protect margins and strengthen supply chain stability.
Solution Offered — Manufacturing Operations Dashboard
A unified, KPI-driven analytics framework designed to connect shop-floor operations with financial, quality, supply chain, and sustainability performance. The solution transforms fragmented manufacturing data into real-time, decision-ready intelligence across plants, products, and processes.
Unified Data Integration & Master Data Governance
- Integrated ERP, MES/PLC, QMS, WMS, and supplier systems into a centralized SQL warehouse to enable cross-functional KPIs across cost, quality, inventory, labor, and fulfillment.
- Standardized BOMs, SKUs, suppliers, routings, and costing structures to ensure a single source of truth for all operational, financial, and compliance reporting.
Cost, Quality & Reliability Intelligence Modeling
- Built standard vs. actual costing, labor productivity, energy-per-unit, and maintenance cost models to track unit cost, variance, margin, and asset efficiency.
- Applied SPC, FPY, defect PPM, MTBF, MTTR, and COQ frameworks to drive proactive quality control and equipment reliability.
Production, Inventory & Supplier Optimization
- Modeled demand forecasts, takt time, capacity utilization, safety stock, and reorder points to balance throughput, service levels, and working capital.
- Embedded supplier OTIF, lead-time variability, inbound quality (supplier PPM), and purchase price variance to stabilize inbound supply and production flow.
Role-Based KPI Dashboards & Performance Views
- Delivered Power BI dashboards for Executives, Plant Leaders, Quality, Supply Chain, Finance, and Maintenance with drill-down from network → plant → line → SKU → batch.
- Visualized OEE, FPY, stockouts, OTIF, labor utilization, contribution margin, energy intensity, and carbon per unit for rapid root-cause analysis.
Key Features of the Dashboard
Built as a real-time command center, the dashboard blends line-level telemetry with financials so leaders can move from detection to action in minutes.
Cost Control Cockpit
Quality Intelligence
Production Planning Board
Inventory & Order Hub
Revenue & Mix Lens
Business Benefits
The program reduced waste, elevated product quality, and tightened inventory control—improving profitability and customer experience end to end.
01
Reduced Manufacturing Costs
Lean interventions and variance visibility cut waste and improved resource allocation, lowering unit costs.
02
Higher Product Quality
Early defect detection and SPC-driven actions improved FPY, reduced scrap/rework, and strengthened brand trust.
Faster, Smoother Fulfillment
Reorder guidance and reliable schedules minimized stockouts/backorders and improved OTIF performance.
04
Revenue Growth Enablement
Clear contribution insights guided product mix, pricing, and market focus to unlock top-line growth.
05
Operational Transparency
A single source of truth aligned plants and leadership on priorities, actions, and outcomes.
Who Gains Actionable Insights from This System?
Tech Stack Used
Designed for governed analytics, fast iteration, and broad adoption across plants.
Microsoft Power BI

APIs & ETL Pipelines

SQL Server Data Warehouse
Results Achieved
With streamlined processes and data-led decisions, the manufacturer improved profitability, quality, and delivery performance.
Key Results:
The new Manufacturing Operations Dashboard now anchors daily huddles and weekly ops reviews—keeping costs in check, quality high, and orders flowing on time.