Health & Safety Analytics Dashboard for Industrial Manufacturing Company
- Home
- Case-Study
- Health & Safety Analytics Dashboard for Industrial Manufacturing Company
Project category
Health & Safety Analytics Dashboard
Industrial Manufacturing
United States (California)
3 Months
Ready to centralize safety data and gain clear visibility into workplace risks?

Project Overview
A large industrial manufacturing organization in California, U.S, struggled to maintain consistent workplace safety oversight across multiple manufacturing facilities. Incident and injury data was scattered across different systems, making consolidated reporting slow and error-prone. Safety teams lacked a single, reliable view to compare current performance with previous years or quickly identify the hazards and incident types causing the most harm.
There was also limited clarity on when incidents occurred most frequently during shifts or operating hours, causing safety decisions to remain largely reactive due to delayed and static reports.
To address these challenges, we developed a centralized Health & Safety Power BI dashboard that unified incident data and standardized safety reporting. The dashboard enabled teams to monitor incident trends, compare year-over-year performance, and identify risk patterns through interactive visuals.
Result: Within the first quarter, safety management gained consistent visibility into incidents, improved reporting accuracy, and strengthened safety governance across operations.
Key KPIs Tracked
These KPIs provide a unified, real-time view of workplace safety by tracking incident trends, injury severity, hazard exposure, and high-risk time patterns to support faster, data-driven safety decisions.
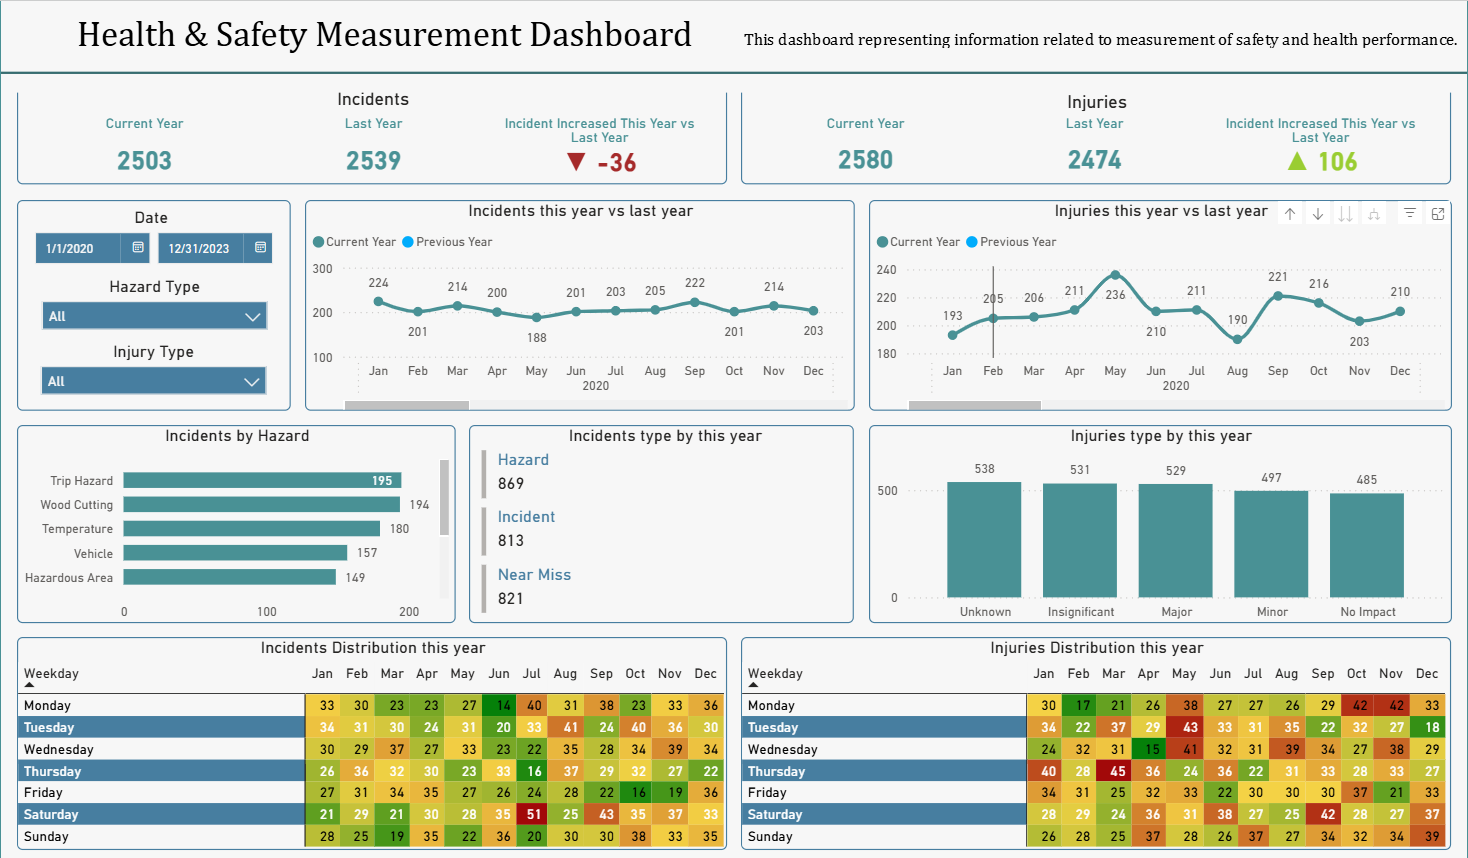
- Total Incidents & Injuries - Compares current year incidents and injuries against the previous year to assess overall safety direction.
- Incident Change vs Last Year - Measures the percentage change in incidents to evaluate whether safety outcomes are improving or declining.
- Injury Change vs Last Year - Tracks changes in injury counts to assess the effectiveness of safety controls and workplace practices.
- Incidents by Hazard Type - Breaks down incidents by hazard categories such as hazardous areas, sharp objects, vehicles, slips, trips, temperature, violence, and wood cutting.
- Incident Type Distribution - Shows how incidents are distributed across different incident types to highlight common safety issues.
- Injury Severity Distribution - Categorizes injuries by severity level to support risk prioritization and compliance reporting.
- High-Risk Time Patterns - Analyzes incidents by shift, hour, and day to identify periods with higher safety risk.
All KPIs were presented as auto-refreshing Power BI visuals that teams could interpret quickly.
Solution Offered — Health & Safety Power BI Dashboard Development
We followed a structured reporting and analytics approach, aligned with best practices in Power BI Development, to build a scalable and reliable safety dashboard.
Safety Data Integration & Preparation
- Incident records, injury logs, hazard registers, and shift data were consolidated into a centralized dataset.
- Data was cleaned, standardized, and validated to ensure consistent reporting across facilities.

Trend & Comparative Analysis
- Historical data was analyzed to identify year-over-year changes, hazard frequency, and time-based incident patterns.
- Comparative views enabled teams to assess performance differences across periods and locations.

Dashboard Design & Visualization
- A Power BI dashboard was designed with executive and operational views for different stakeholders.
- Visuals included trend charts, hazard breakdowns, severity distributions, and time-based analysis.

Automated Refresh & Threshold Indicators
- The dashboard refreshes automatically as new safety data is recorded.
- KPI indicators highlight increases in incidents or injuries based on defined thresholds.

Insight Sharing & Collaboration
- Role-based access allows safety officers, plant managers, and compliance teams to review the same data.
- Reports are easily shared for audits, reviews, and corrective action planning.

Core Features of the Dashboard
The dashboard enables consistent and transparent safety monitoring through year-over-year comparisons, detailed hazard and injury analysis, high-risk time insights, interactive drill-downs, and shareable Power BI reports for manufacturing data analytics and decision-making.
What Businesses Benefit From Health & Safety Dashboard?
The dashboard delivers measurable safety improvements by reducing incidents, enhancing performance visibility, enabling proactive risk management, strengthening compliance, and fostering a data-driven workplace safety culture.
01
Reduce Workplace Incidents
Clear visibility into hazard and time-based trends helps teams focus on prevention.
02
Improve Safety Performance Visibility
Standardized year-over-year comparisons support informed leadership reviews.
Support Proactive Risk Management
High-risk shifts and activities can be addressed through targeted safety actions.
04
Strengthen Compliance & Reporting
Consistent severity classification simplifies audits and regulatory reporting.
05
Promote a Data-Driven Safety Culture
Teams rely on accurate dashboards instead of manual spreadsheets and delayed reports.
Who Gains Actionable Insights from This Dashboard?
Tech Stack Used
This tech stack combines Power BI, Azure Analytics Services, and SQL with Python to enable reliable data integration, automated processing, and real-time visualization of safety KPIs and trends.
Power BI

Azure Analytics Services

SQL & Python
Results Achieved
The Health & Safety Power BI dashboard significantly improved safety visibility and decision-making by unifying reporting, accelerating risk detection, and enabling timely, data-driven responses across the organization.
Key Results:
The organization successfully transitioned from fragmented safety reporting to consistent, insight-driven monitoring, reducing operational risk and improving workplace conditions.