Call Center Performance Analytics Dashboard
- Home
- Case-Study
- Call Center Performance Analytics Dashboard
Project category
Call Center Performance Analytics Dashboard
Customer Support & Contact Center
United States
3 Months
Talk to our analytics experts to build a tailored call center performance dashboard today.

Project Overview
A large enterprise contact center struggled to gain timely insights into operational performance due to scattered data across multiple telephony, CRM, and workforce management systems. Leadership lacked a single, consolidated view of agent productivity, call trends, customer experience signals, and key performance metrics like first call resolution or average wait time. Reporting was manual, slow, and couldn’t support proactive performance management or real-time decision-making.
To address these gaps, we developed a centralized Call Center Performance Analytics Dashboard using Power BI. This dashboard unified call logs, agent metrics, and customer service data into a cohesive analytics platform that instantly delivers performance insights across teams.
Result: Within the first month of deployment, contact center managers gained real-time visibility into agent productivity, call trends, and customer experience metrics, enabling faster performance optimization and improved service delivery.
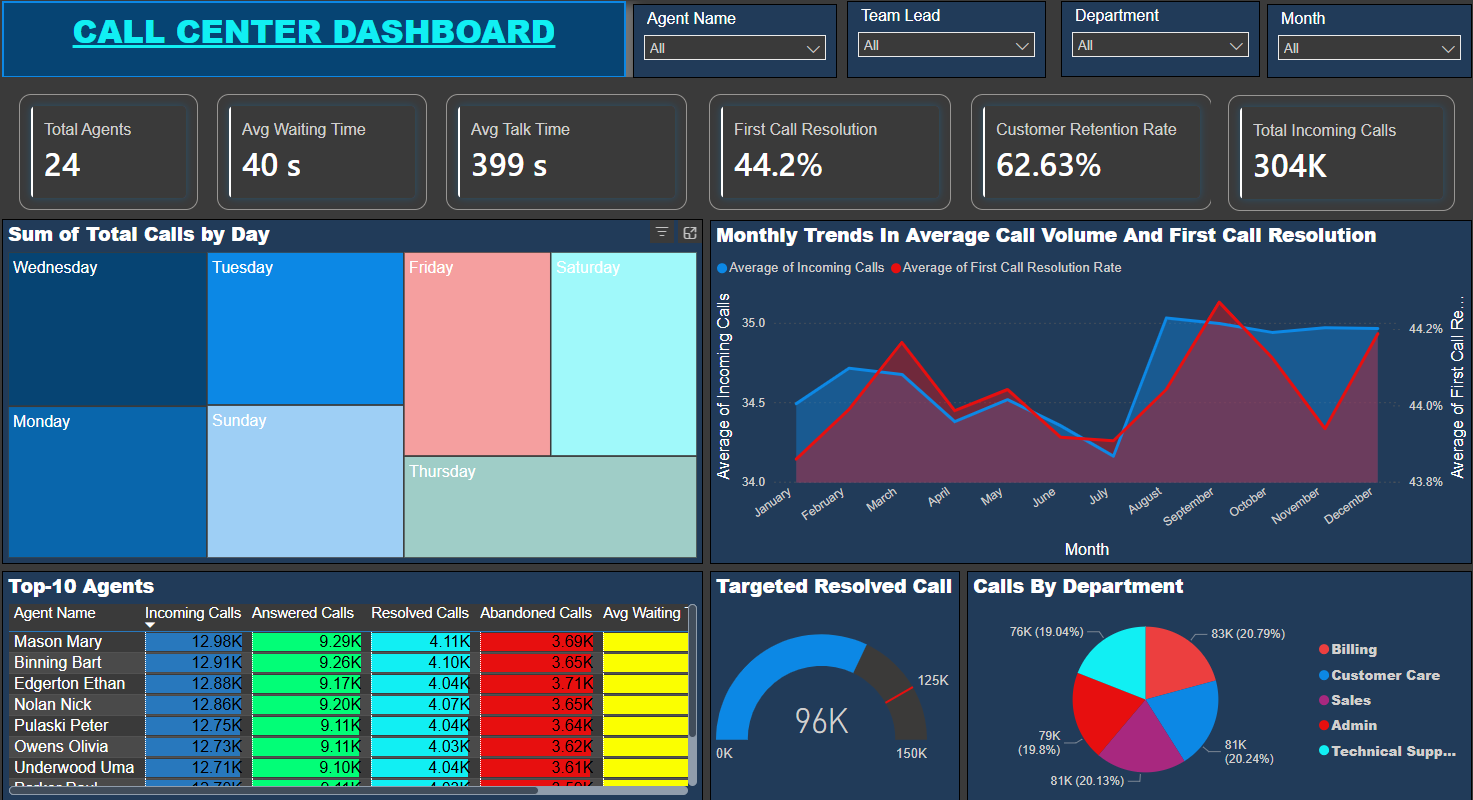
Key KPIs Tracked
The Call Center Dashboard tracks critical operational and customer experience metrics, empowering contact center leaders to monitor performance, identify bottlenecks, and improve call outcomes.
- Total Agents: Shows the total number of active agents handling calls, helping assess staffing levels.
- Total Incoming Calls: Captures the total volume of incoming calls, highlighting demand patterns.
- Sum of Total Calls by Days: Displays daily call volumes to uncover peak call days and support staffing decisions.
- Top-10 Agents by Resolved Calls: Ranks agents by the number of resolved calls to recognize top performers and identify coaching needs.
- Monthly Trends in Average Call Volume & First Call Resolution: Tracks month-over-month variations in call load and first call resolution rates to identify performance trends.
- Targeted Resolved Calls: Measures resolved calls against target goals to evaluate service effectiveness.
- Calls by Department: Breaks down incoming calls by department or service queue to reveal high-demand areas.
- Average Waiting Time: Shows average time callers wait before connecting with an agent, indicating service responsiveness.
- Average Talk Time: Monitors the average talk duration per call to balance efficiency with quality.
- First Call Resolution Rate: Tracks the percentage of calls resolved on first contact, a key customer satisfaction metric.
- Customer Retention Rate: Measures repeat customer interactions as a proxy for service satisfaction and loyalty.
Each KPI is delivered through interactive visuals with drill-downs by team, shift, and time period.
Solution Offered
The power bi dashboard was developed using a structured analytics approach to ensure accurate insights, usability, and scalability across operational teams.
Data Integration & Preparation
Call logs, agent performance data, CRM records, and workforce scheduling data were combined into a unified data model. Data quality checks ensured consistency across sources and time frames.
Performance Trend & Pattern Analysis
Historical call data was analyzed to identify workload trends, peak call times, and first call resolution performance across periods.
Dashboard Design & Visualization
A tailored Power BI dashboard was designed with executive, operational, and team-lead views. Visuals included trend charts, performance ranking, wait time analysis, call distribution by department, and customer retention signals.
Automated Refresh & Performance Alerts
The dashboard is configured to auto-refresh with the latest call and agent data. KPI indicators highlight areas needing attention, such as rising wait times or declining resolution rates.
Insight Sharing & Collaboration
Role-based access allows managers, supervisors, and directors to view and share insights. Reports can be used in performance reviews, daily standups, and strategic planning.
Core Features of the Dashboard
The dashboard converts call center data into interactive, shareable insights that support performance management and customer experience improvement:
Why Call Centers Need a Performance Dashboard?
A Call Center Performance Dashboard enables contact centers to make faster, data-driven decisions and improve service outcomes.
01
Optimize Staffing & Scheduling
Daily and monthly call trends align agent availability with real demand.
02
Improve Customer Experience
Wait time, talk time, and first call resolution insights drive service quality improvements.
Enhance Agent Productivity
Performance rankings and trends highlight coaching and optimization opportunities.
04
Enable Proactive Management
Real-time dashboards replace manual reports with actionable, timely insights.
05
Support Strategic & Cost Decisions
Cross-period performance and retention metrics guide resource planning and cost control.
Who Gains Actionable Insights from This Dashboard?
Technology Stack
This technology stack was finalized to handle high-volume call data, support near real-time reporting, and integrate seamlessly with existing telephony and CRM systems.
It provides the scalability, data reliability, and automation required to move from manual reporting to continuous performance monitoring.
Power BI

Azure Analytics Service

Python & SQL
Results Achieved
After deploying the Call Center Performance Analytics Dashboard, the contact center achieved measurable performance gains:
Key Results:
The organization shifted from fragmented performance tracking to real-time, insight-driven contact center management.