Academic Performance Analytics Dashboard for Educational Institutions
- Home
- Case-Study
- Academic Performance Analytics Dashboard for Educational Institutions
Project category
Academic Performance Analytics Dashboard for Educational Institutions
Education
Sweden
4 Months
Looking to gain real-time visibility into student performance, attendance risks, and academic outcomes?

Project Overview
A mid-sized academic institution was managing student data across multiple systems, but getting a clear picture of how students were actually performing was becoming difficult. Academic scores, attendance, and disciplinary records all existed, yet they were disconnected. This made it hard for leadership and faculty to understand overall academic health or spot problems early.
Simple but important questions like which students needed extra support, how attendance affected results, or whether performance was improving each term took time and manual effort to answer. As student numbers grew, teams struggled to track trends, identify at-risk students early, and understand how behavior and engagement were impacting academic outcomes.
To make this easier, an Academic Performance Analytics Dashboard was built using Power BI. It brought all academic, attendance, and behavioral data into one clear, interactive view.
Result: Education leaders gained real-time visibility into student outcomes, academic risks, and performance trends, supporting proactive interventions and smarter academic planning.
Key KPIs Tracked
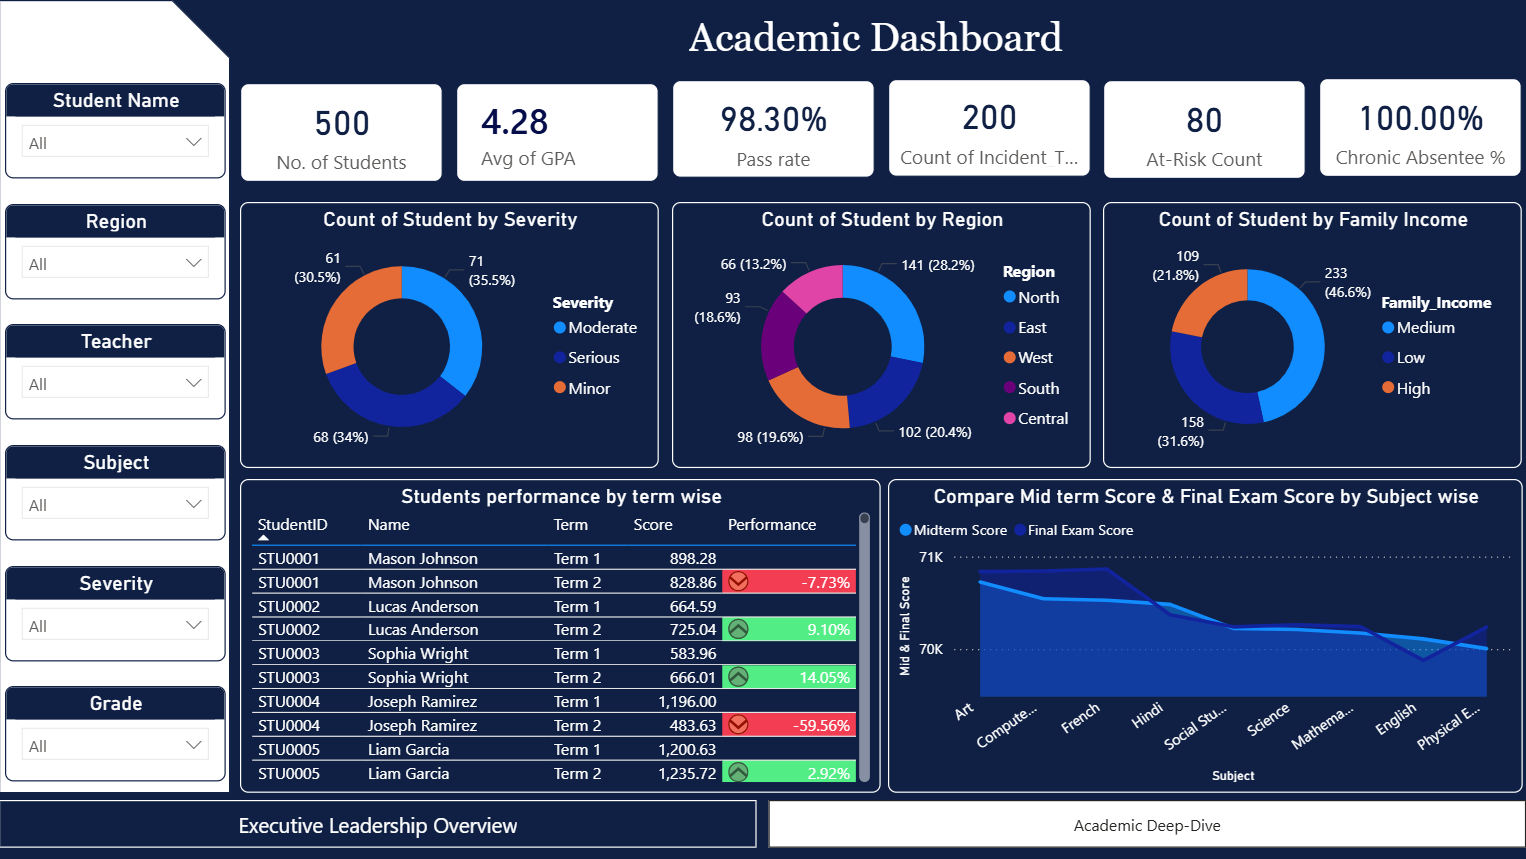
The Academic Performance Dashboard tracks core academic, engagement, and risk indicators, enabling institutions to measure learning outcomes and student well-being effectively through education data analytics services.
- Total Students / Total Teachers - Measures student-to-teacher ratio to evaluate academic capacity and instructional load.
- Average GPA - Tracks overall academic performance across programs and cohorts.
- Pass Rate % - Highlights the percentage of students meeting academic completion criteria.
- At-Risk Student Count - Identifies students requiring academic intervention based on GPA, attendance, and performance trends.
- Chronic Absentee Percentage - Monitors attendance health and flags persistent absenteeism risks.
- Incident Count - Captures total disciplinary or behavioral incidents affecting academic stability.
- Student Count by Severity - Breaks down incidents to assess behavioral impact on learning outcomes.
- Study Hours vs Final Exam Score - Analyzes correlation between student effort and academic results.
- Term-wise Student Performance % Change - Compares academic performance trends across terms to measure improvement or decline.
- Education data analytics - Uses education data analytics to identify at-risk students through GPA, attendance, and performance trends for early intervention.
Each KPI is delivered through interactive visuals, enabling real-time filtering by class, program, term, or individual student profiles.
Solution Delivered – Academic Performance Analytics with Power BI
The dashboard was developed using a structured analytics framework to ensure data accuracy, scalability, and usability across academic and administrative teams.
Data Integration & Structuring
Student records, assessment scores, attendance logs, study hour inputs, and incident data were consolidated into a unified academic data model. Data quality checks ensured consistency across terms, programs, and student cohorts.

Academic Trend & Risk Analysis
Historical academic data was analyzed to uncover performance trends, attendance patterns, and early risk indicators. Comparative views highlighted term-over-term changes and emerging academic concerns.

Analytics-Driven Dashboard Design
Role-specific views were designed for administrators, academic leaders, and faculty teams. Visuals emphasized clarity allowing users to move seamlessly from institution-wide summaries to individual student insights.

Automated Refresh & Performance Signals
The dashboard refreshes automatically with the latest academic and attendance data. Visual indicators highlight declining GPA trends, rising absenteeism, and increasing at-risk student counts.

Shared Access & Intervention Support
Academic teams, counselors, and leadership access a single source of truth, supporting coordinated interventions, review meetings, and performance planning.

Core Features of the Dashboard
The dashboard transforms complex academic data into clear, actionable insights, enabling institutions to improve learning outcomes and student engagement.
Why Institutions Need an Academic Performance Dashboard?
An Academic Performance Dashboard empowers educational institutions to move from reactive reporting to proactive academic management, providing real-time insights that help drive better decision-making.
01
Proactive Student Intervention
Early identification of at-risk students enables timely academic and counseling support.
02
Improved Academic Planning
Performance and trend insights support curriculum planning and instructional optimization.
Stronger Attendance & Engagement Monitoring
Attendance and behavior analytics reveal engagement gaps affecting learning outcomes.
04
Faster, Data-Driven Decisions
Leadership gains immediate insight without waiting for manual reports.
05
Reduced Reporting Burden
Automated analytics replace repetitive spreadsheet-based academic reporting.
06
Enhanced Collaboration Across Teams
A unified dashboard allows faculty, administrators, and counselors to collaborate efficiently on student progress and intervention strategies.
Who Benefits from This Dashboard?
Technology Stack
The dashboard leverages Power BI for dynamic reporting and analytics, Google BigQuery for seamless data processing and transformation, and R for advanced analysis and automation, ensuring efficient data workflows and actionable insights.
Power BI

Google BigQuery
R
Results Achieved
After implementing the Academic Performance Dashboard, the institution achieved measurable improvements in academic visibility and decision-making:
Key Results:
The institution transitioned from fragmented academic reporting to a structured, analytics-driven approach for monitoring student performance and academic outcomes.