Key Highlights:
- Business Intelligence Dashboards give businesses instant clarity with real-time insights and enable business-focused critical decisions.
- BI dashboards help businesses stay competitive by revealing trends, rising demand, and customer behavior early, enabling faster decisions, reduced wastage, and more opportunities.
- Different types of BI dashboards, including operational, strategic, analytical, predictive, self-service, and KPI dashboards, to support better decision-making, stronger planning, and smoother daily operations.
Ever wondered how companies like Walmart make split-second decisions across thousands of stores without breaking a sweat?
They rely on powerful Business Intelligence Dashboards that show real-time sales, inventory gaps, and customer trends in one visual snapshot, the kind that tells you what’s happening right now and what needs to happen next.
Now, let’s bring this closer to you.
Imagine opening a single dashboard every morning and instantly seeing:
- Your best-selling products
- Today’s revenue compared to last week
- where your operations are slowing down
- Which KPIs need your attention today, not after the month ends
Feels like having a business control room, right? That’s exactly what Business Intelligence Dashboards are built for, turning scattered data into clear, visual stories that guide smarter decisions.
And here’s the real shift: Businesses are no longer using dashboards just to monitor data. They’re using them to move faster, catch patterns earlier, and make decisions backed by real-time insights instead of assumptions.
Did you know, teams using BI dashboards make decisions 2.7× faster because everything they need is visual, real-time, and one click away.
Want to know more about Business Intelligence (BI) dashboards, why these are important, types of BI dashboards, and more? Then this blog is all you need.
What is a Business Intelligence Dashboard?
A Business Intelligence Dashboard is your business’s real-time control panel, the place where all your sales, customers, operations, marketing, and finance data come together in one clean, visual, easy-to-read view—often delivered and customized through professional Business Intelligence services. Instead of digging through spreadsheets or waiting for weekly reports, a BI dashboard shows you exactly what’s happening right now and what needs your attention.
Think of it like this
Imagine you run a growing D2C skincare brand. You’re selling on your website, Amazon, and Instagram Shop. Your ads run on Meta and Google. Your inventory is scattered across two warehouses.
Normally, you’d have to check 7 different platforms to know:
- Which product is selling the fastest
- Which ad is wasting budget
- Which warehouse is hitting low stock
- Which customer segment is buying again
- Whether revenue is growing today or dipping
With a Business Intelligence Dashboard, all of this shows up in one single place, live.
- If your Vitamin C serum suddenly spikes in sales, you see it.
- If your ad costs jump, you see it.
- If your repeat customers drop, you see it.
No scrolling. No guessing. No chasing data across apps. Just clear insights → faster decisions.
This is why modern brands, from small shops to enterprise teams, rely on BI dashboards to stay ahead of demand, optimize spending, and operate with clarity instead of chaos.
What Are the Different Types of Business Intelligence Dashboards?
Each type of BI dashboard has a different purpose, and that’s the beauty of Business Intelligence Dashboards, you can mix and match depending on what your business needs.
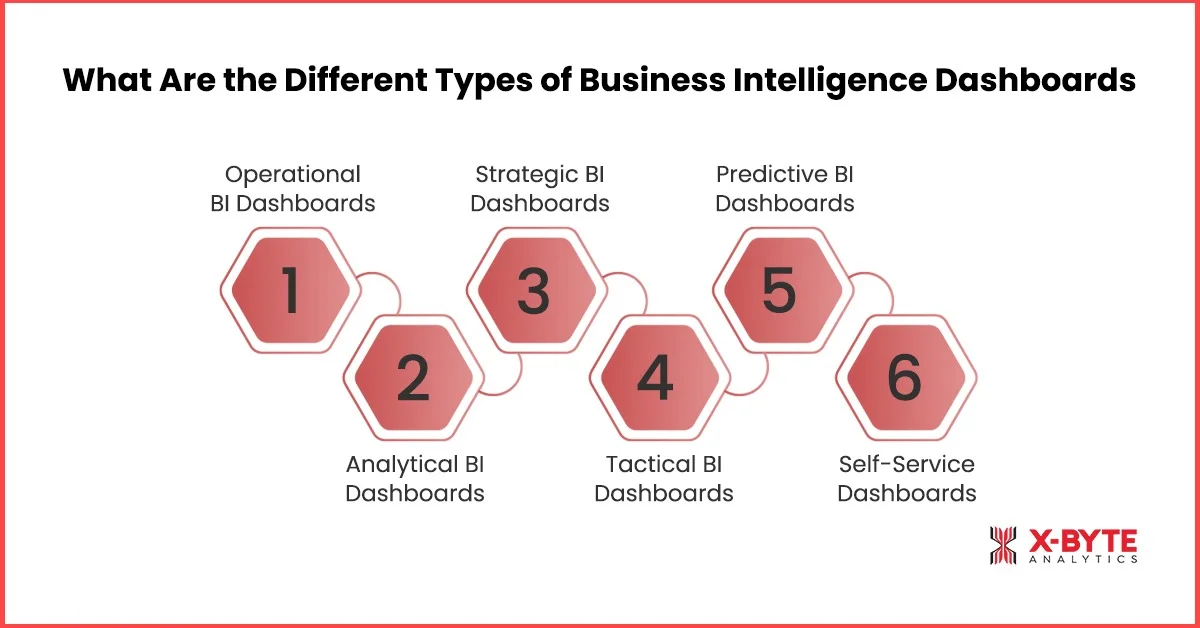
1. Operational BI Dashboards (Real-Time BI Dashboards)
An operational dashboard shows what’s happening in your business right now. It tracks live metrics so you can spot issues or wins as they unfold.
What it includes:
- Real-time BI dashboards showing live activity
- Data visualization dashboards for quick scanning
- KPI dashboards for business teams who need instant updates
When to use: Use it when your team needs to monitor tasks, performance, or customer activity throughout the day. These dashboards in Business Intelligence are perfect for catching problems early, reducing delays, and making quick decisions without waiting for reports.
2. Analytical BI Dashboards
Analytical dashboards help you dig deeper into trends. Instead of showing what’s happening right now, they show why something happened by combining historic data, comparisons, and insights.
What it includes:
- Trend analysis
- Data drill-downs
- Forecasts and patterns
- BI dashboard examples, like monthly performance breakdowns
When to use: Use them when you want to understand long-term performance, uncover root causes, compare periods, or plan. If your goal is to understand how BI dashboards help decision-making, analytical dashboards are the best place to start.
3. Strategic BI Dashboards
These dashboards zoom out and show the bigger picture. They’re used by leadership and managers to track progress toward long-term goals.
What it includes:
- High-level KPIs
- Progress against targets
- Long-term business performance
- KPI dashboards for business growth tracking
When to use: Use these when you’re planning a strategy, checking if the business is on track, or reviewing quarterly/annual outcomes. They’re ideal when you need to present clear data visualization dashboards to stakeholders without overwhelming them.
4. Tactical BI Dashboards
A tactical dashboard sits between operational and strategic. It helps teams plan weekly or monthly improvements based on ongoing performance.
What it includes:
- Team performance metrics
- Weekly/Monthly KPIs
- Task-level insights
- Visuals that help teams adjust priorities
When to use: Use this when your team needs more direction than daily dashboards provide, but more detail than strategic dashboards offer. These dashboards support decision-making by showing what needs attention next, helping reduce wastage, optimize tasks, and ultimately improve sales and efficiency.
5. Predictive BI Dashboards
A Predictive BI Dashboard looks beyond what happened and shows what’s likely to happen next. It uses your historical data, trends, seasonality, and patterns to forecast future outcomes.
What it includes:
Predicted demand, forecasted sales, future performance curves, risk indicators, often powered by AI/ML inside the best BI dashboard tools.
When to use: Whenever you need to plan ahead. Perfect for budgeting, demand planning, preparing resources, setting monthly/quarterly targets, or spotting risks before they hit. These dashboards show the importance of dashboards in BI because they help leaders shift from reacting to proactively steering the business.
6. Self-Service Dashboards
A Self-Service Dashboard is built for teams that aren’t data experts. It lets anyone, marketing, HR, sales, operations, explore insights on their own without waiting for analysts.
What it includes:
Simple filters, drag-and-drop widgets, easy charts, and guided insights.
When to use: Use this when you want your team to move fast, marketing, HR, sales, and operations, without waiting for a new report. This type supports the importance of dashboards in BI by making insights accessible to everyone.
Benefits of the Business Intelligence Dashboard
Every business has data, but the real advantage comes from seeing what matters as it happens. That’s where Business Intelligence Dashboards change the game. And once you start using real-time BI dashboards, you realize how much you were missing before, the tiny shifts, the early warnings, the hidden opportunities.
Let’s keep reading to know more about the benefits of business intelligence dashboards.
1. Faster, Smarter Decision-Making
You open your BI dashboard, and instead of guessing what happened yesterday, everything is right there: sales trends, team activity, customer engagement, and any operational spikes you should know about.
Dashboards in Business Intelligence give you real-time insights. No scrolling through reports, no waiting for updates, just instant clarity so you can act faster and smarter.
2. It helps you catch small problems before they turn into big headaches.
One quiet superpower of real-time BI dashboards is how they highlight tiny shifts you’d probably miss on a normal day, maybe a dip in performance, a rise in customer questions, or a slowdown in any workflow.
These small signals matter. A Business Intelligence Dashboard alerts you about maybe a recent negative customer experience, a recent stockout, problem with a recent supply. And that simple heads-up helps you fix things today, not two weeks later.
3. It cuts down unnecessary back-and-forth across teams.
A good KPI dashboard for business shows everyone the same numbers, the same trends, and the same story, at the same time. No chasing updates, no messy spreadsheets, no Who has the latest version? moments.
Whether someone is checking marketing results or daily operations, BI dashboards remove the noise and let teams focus on what actually needs their attention. You end up spending more time improving things and less time searching for answers.
4. Stay ahead of your competitors.
When your dashboard shows real-time trends, shifting customer behavior, or sudden demand spikes, you can act faster than businesses still relying on weekly reports.
Maybe you notice a product gaining traction or a channel suddenly performing better, your competitors will figure it out later, but you get to move now. That quick reaction creates a quiet but powerful competitive edge, and it comes simply from seeing what others don’t, early.
5. It reduces everyday wastage
With data visualization dashboards, waste becomes visible, including unused inventory, repeated tasks, and extra hours spent on the wrong priorities. A Business Intelligence Dashboard shows these leaks in plain sight, so you can plug them before they drain your time or money.
It’s not about big operational overhauls; sometimes it’s just spotting what’s unnecessary and removing it.
6. Spot opportunities for more sales
When you see what’s selling faster, which touchpoints customers are responding to, or where demand is quietly rising, you can act sooner. Instead of waiting for a monthly report, real-time BI dashboards show you the moment something starts trending, so you can push the right products, adjust pricing, or ramp up campaigns while the window is still open. That tiny timing advantage often becomes a solid competitive edge.
7. It helps you manage and improve customer experience effortlessly.
When your dashboard highlights customer activity, peaks in inquiries, drops in satisfaction, and changes in behavior, you quickly understand what they need right now. This makes it easier to fix friction points, respond faster, personalize communication, and create a customer journey that feels smooth.
In BI terms, this is decision-making support, but in daily business life, it’s simply understanding your customers so well that they naturally stick around longer.
8. It saves hours of manual reporting every week.
No more spreadsheets, no more waiting for someone to compile the numbers. With dashboards in Business Intelligence, your reports update themselves. That means more time doing meaningful work and less time collecting scattered data. It makes your operations lighter, faster, and much more efficient.
Partner With X-Byte Analytics To Unlock The Full Potential Of Your Business Intelligence Dashboards Service Today!
What is the Difference Between BI Dashboards and BI Reports?
If you’ve ever wondered why businesses use Power BI Dashboards and BI Reports when they already receive reports every week, here’s the simple truth: both serve very different purposes, and knowing when to use which can completely change how fast and confidently your team makes decisions.
The table below breaks it down clearly so you instantly understand the importance of dashboards in BI and when detailed reports matter more.
| Aspect | BI Dashboards | BI Reports |
| Purpose | Give you a real-time, at-a-glance view of what’s happening in your business right now. | Provide deeper, structured information about past performance, trends, or specific areas you want to analyze. |
| Usage Style | You open it daily to check KPIs, spot changes, and make quick decisions. | You refer to it when you need detailed explanations, monthly summaries, or when you want to formally present data. |
| Data Refresh | Usually real-time or near real-time. Updates keep happening in the background. | Often static or scheduled, daily, weekly, or monthly, unless you manually refresh it. |
| Interaction Level | Highly interactive, you can click, filter, drill down, and explore different angles. | Low interaction, mostly read-only documents or static views. |
| Depth of Information | Focuses on what’s happening now while offering big-picture clarity and quick signals. | Goes deeper into the why it happened, providing context, historical data, and detailed breakdowns. |
| Best For | Monitoring KPIs, tracking daily movement, catching issues early, and guiding quick decision-making. | Audits, performance reviews, forecasting discussions, executive summaries, and in-depth analysis. |
| Format | Visual charts, cards, trends, and alerts laid out on one screen. | Document-style pages with tables, narrative explanations, and detailed figures. |
| Audience | Teams who need live updates: operations, marketing, sales, and leadership. | Teams that need detailed documentation: finance, strategy, compliance, and senior management. |
| Accessibility | Easy to interpret even for non-technical users. | Can be technical & may require someone familiar with the data. |
Business Intelligence (BI) Dashboard Examples
Business Intelligence dashboards come in all shapes depending on what a business needs to see, measure, or fix. Each business intelligence dashboard implementation brings its own mix of KPIs, visualizations, and real-time insights, and when used well, they turn everyday decisions into smarter, faster, and more confident ones.
Below are a few popular BI dashboard examples that show how different teams use data to stay one step ahead.
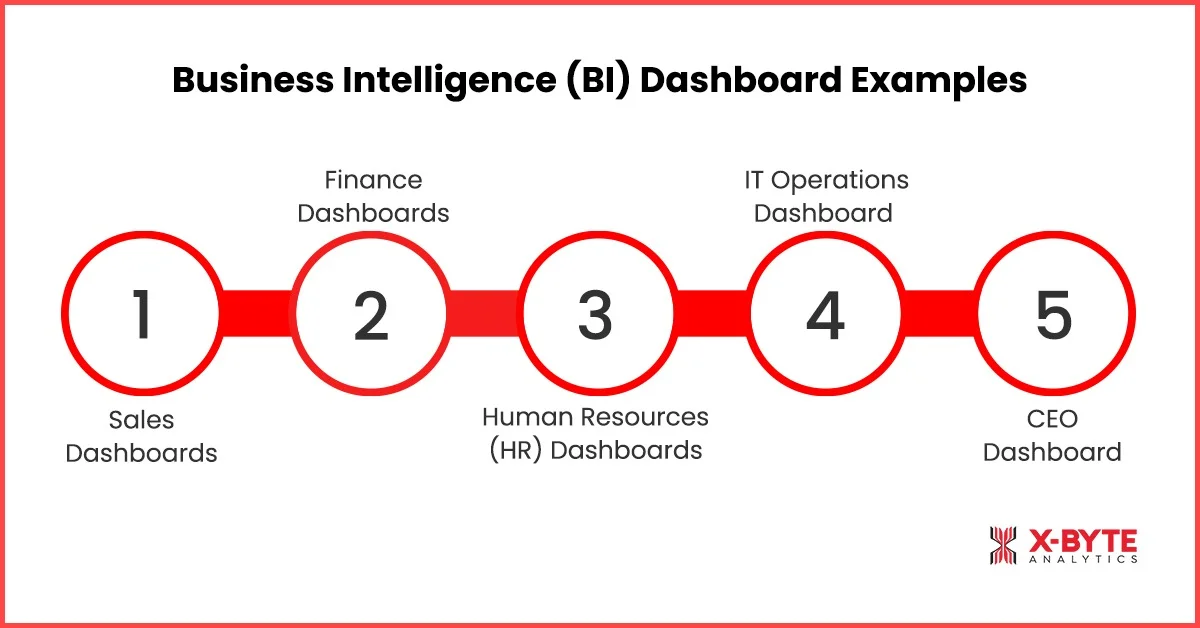
1. Sales Dashboards
A Sales Dashboard is a data visualization dashboard that gives you a live picture of how your sales are performing. It pulls all your sales KPIs into one screen so you can see what’s selling, what’s slowing down, and where revenue is coming from.
What it includes: Sales trends, daily/weekly/monthly revenue, conversion performance, top products, top regions, customer activity, pipeline stages, and real-time BI dashboard alerts.
How it helps: It removes the guesswork from day-to-day selling. You instantly see whether numbers are moving in the right direction and what needs your attention, maybe a dip in conversions, a sudden push in a product category, or an outperforming region. These KPI dashboards for business help teams act faster, adjust targets, fix bottlenecks, and double down on the opportunities already working.
2. Finance Dashboards
A Finance Dashboard gives decision-makers a clear and organized view of the business’s financial health. It’s like your financial command center, showing the money flowing in, out, and where it’s stuck.
What it includes: Cash flow trends, expenses, revenue performance, budget vs. actuals, profit margins, forecasts, and financial risk indicators.
How it helps: Instead of waiting for end-of-month reports, you can spot patterns instantly, overspending, delayed payments, or cash flow crunches and fix them before they become bigger problems. This supports how BI dashboards help decision-making, especially when planning budgets, cutting costs, or allocating resources.
3. Human Resources (HR) Dashboards
An HR Dashboard shows everything you need to know about your team in one place, from hiring progress to performance insights. It turns scattered HR data into visual stories you can understand at a glance.
What it includes: Hiring pipeline, employee performance trends, attendance, turnover rate, training metrics, engagement scores, and workforce analytics.
How it helps: It helps leaders see where teams are thriving and where support is needed. Maybe a department is overloaded, onboarding is slowing down, or training results are dipping. With these dashboards in business intelligence, HR teams can make fast decisions that keep people productive and motivated.
4. IT Operations Dashboard
An IT Operations Dashboard offers a real-time view of your tech performance. It keeps track of systems, uptime, tickets, and overall IT health, all visualized on a single screen.
What it includes: System uptime/downtime, ticket status, response times, network performance, application health, incident trends, and alerts.
How it helps: It lets IT teams fix issues before users even notice them. If a system slows down or a spike in errors appears, the dashboard highlights it immediately. This improves operational efficiency and reduces downtime, making it one of the most valuable real-time BI dashboards for seamless day-to-day operations.
5. CEO Dashboard
A CEO Dashboard gives leadership a complete snapshot of the entire business, from sales and finance to operations and customer experience. It’s the high-level view needed for strategic decisions.
What it includes: Company-wide KPIs, performance vs. goals, top challenges, forecasts, customer insights, revenue trends, and operational highlights.
How it helps: It cuts through the noise and gives leaders clarity. Instead of digging through reports from multiple departments, CEOs get a clean, visual summary that shows what’s working, what’s falling behind, and where to focus next. These dashboards show the importance of dashboards in BI by helping leaders stay aligned and move the company forward with confidence.
Conclusion
A good Business Intelligence Dashboard doesn’t just organize your data; it helps your team work smarter, move faster, and make decisions with a lot more confidence.
And as your business grows, the need for clearer insights only becomes stronger. That’s where having the right BI setup can make all the difference.
At X-Byte Analytics, we help businesses build dashboards that don’t just look good; they genuinely support day-to-day operations and long-term strategy. Whether you’re trying to make sense of scattered data, add real-time visibility, or give your team self-service access to insights, our Power BI development services are designed to fit your workflow, not complicate it.
If you’re ready to turn your data into something your team can actually use, let’s talk. Get in touch with X-Byte Analytics and start building dashboards that move your business forward. Book a free consultation call today.