IT Operations Dashboard
Take control of your IT landscape with precision-engineered dashboards designed for performance, resilience, and strategic growth. Downtime, security breaches, performance lags, and bottlenecks can cost millions and ruin customer trust. That’s why X-Byte Analytics delivers high-impact, mission-critical dashboards that leave no aspect of your IT environment untracked. We offer the best IT operations dashboard for enterprises that promise agility, accountability, and actionable intelligence.

Trusted by conglomerates, enterprises, and startups


What is an IT Operations Dashboard?
The IT management dashboard acts like a centralized digital platform that provides real-time visibility into key functions. This includes infrastructure health, service desk performance, cybersecurity posture, project executions, and financial management. Moreover, it consolidates critical IT operations metrics into visually dynamic panels to empower IT leaders and stakeholders to proactively identify issues, track performance, and align IT with business objectives.
Furthermore, these IT system monitoring tools enable IT leaders, decision-makers, and frontline technicians to monitor performance closely, detect anomalies, resolve issues faster, and ensure that IT activities align with business outputs. The idea is to turn data into action, help teams manage capacity, improve service delivery, prevent downtime, and justify IT investments with clear metrics.
Live Dashboard
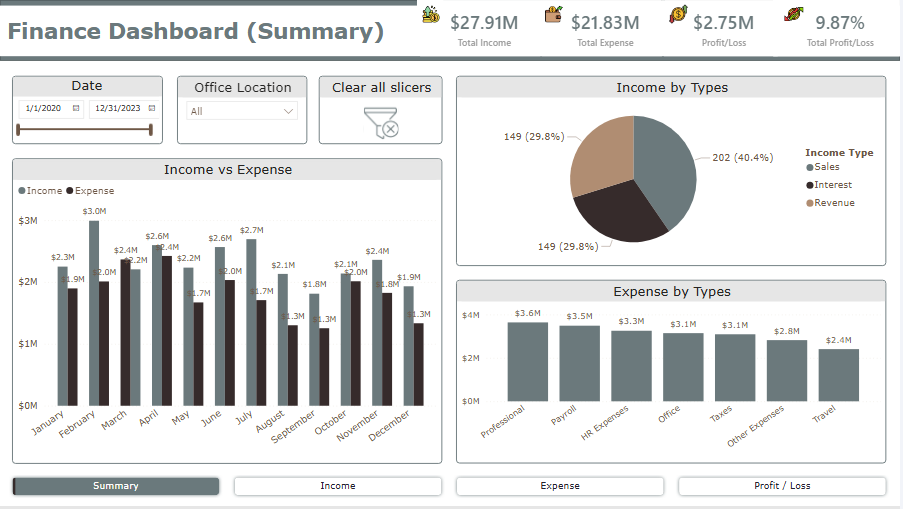
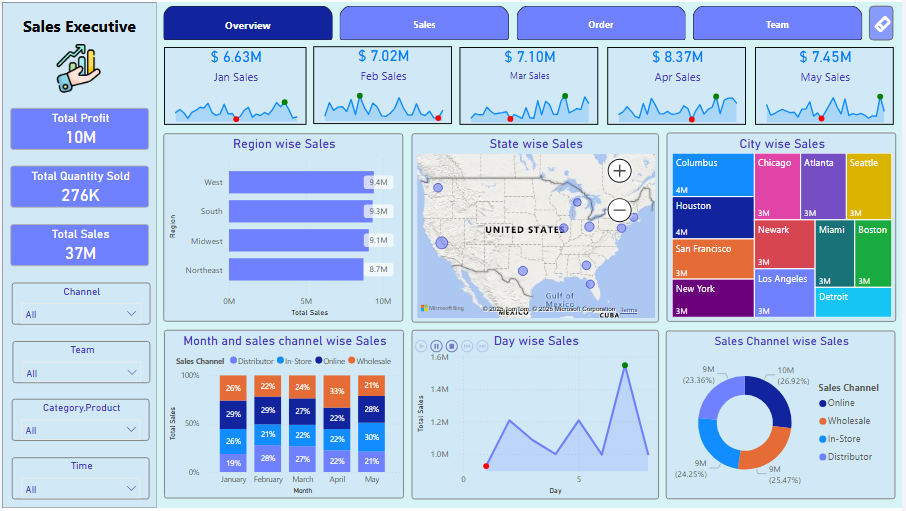
A live IT operations dashboard empowers teams to stay ahead of issues, optimize resources, and ensure business continuity. From infrastructure monitoring and incident tracking to financial forecasting and executive reporting, these dashboards transform data into action. Here are some live IT operations dashboard examples demonstrating real-time monitoring, intuitive UI, and actionable insights across various IT domains.
Contact Us Today
Why Use an IT Operations Dashboard?
The modern IT environment has become a complex web of interconnected systems, applications, endpoints, and services. Hence, it is impossible to manage things efficiently without effective consolidation, automation, and quick visibility. An IT operations metrics dashboard is a centralized command center, transforming raw, dispersed data into meaningful, actionable intelligence.
Not only this, organizations can pinpoint underperforming departments or assets, help redirect resources, and eliminate inefficiencies. Tracking IT spend against actual business value also becomes straightforward, empowering better budget decisions and justifying investments with data-backed ROI insights.
Lastly, aligning operational KPIs with border organizational goals increases transparency and accountability, ensuring IT doesn’t operate in a silo but drives strategic growth. Real-time monitoring fuels incident response, improves SLA adherence, and enables teams to maintain seamless uptime and service quality in this global digital village.

What are the Benefits of IT Operations Analytics Dashboard?
Organizations today depend heavily on IT systems to power every function. Managing a complex, distributed IT infrastructure requires more than isolated tools and scattered reports. This is where the IT dashboard managing services come in. These intelligent, centralized platforms transform raw data into real-time, actionable insights, helping IT leaders optimize performance, cut costs, and proactively mitigate risks. Here are the key benefits of implementing an advanced IT operations analytics dashboard:
Whether you need to adapt one of these templates or build one from scratch, X-Byte’s Operation Dashboard Power BI consultants are here to help you craft functional dashboards that are visually stunning.
One size doesn’t fit all in IT, either. Role-based dashboards allow each user to view only what’s relevant to them. This ensures clarity, reduces noise, and enhances productivity at every organizational level.
Don’t wait for users to report issues. Get ahead of them now. Dashboards with anomaly detection and automated alerts help IT teams identify trends and anticipate failures before they impact operations.
Get an instant pulse on your IT ecosystem now. This includes servers, applications, databases, cloud services, and network devices. Dashboards continuously monitor system performance and availability, allowing your team to detect anomalies, downtime, or bottlenecks as they happen.
Say goodbye to guesswork. With visualized metrics, trend patterns, and historical analytics, decision-makers can base strategies on data-driven evidence rather than assumptions.
Get complete transparency into IT spending. Analytics dashboards reveal underutilised resources, unnecessary tools, and recurring bottlenecks that drain budgets.
Types of It Operations Dashboard
Explore X-Byte’s comprehensive enterprise-grade IT dashboard services crafted to diverse IT operational needs. These are designed to drive performance, precision, and proactive management.
IT Financial Management Dashboard
Benefits of IT Financial Management Dashboard
- Optimize ROI
- Real-time budget tracking
- Forecast future IT investments
- Identification of financial inefficiencies
IT Service Management Dashboard
Benefits of IT Service Management Dashboard
- Faster issue resolution
- End-to-end ITSM visibility
- Proactive workload balancing
- Data-driven service optimization
Project Management Dashboard
Benefits of Project Management Dashboard
- Enhanced resource optimization
- Budget control and ROI insights
- Clear Ownership and accountability
- Proactive risk & blocker management
Customer Service Performance Dashboard
Benefits of Customer Service Performance Dashboard
- Common complaints tracker
- Identification of trends in customer feedback
- Bridge service delivery gaps across platforms.
- Boost agent productivity & accountability
IT Project Performance Dashboard
Benefits of IT Project Performance Dashboard
- Project health at a glance
- Historical analysis & benchmarking
- Boost in accountability & ownership
- Improved stakeholder communication
Service Desk Dashboard
Benefits of Service Desk Dashboard
- Smarter ticket routing
- Cross-channel integration
- Data-backed decision making
- Customizable dashboards for stakeholders
IT infrastructure Dashboard
Benefits of IT infrastructure Dashboard
- Faster incident response
- Proactive issue detection
- Scalability with confidence
- Enhanced end-user experience
Cybersecurity Dashboard
Benefits of Cybersecurity Dashboard
- Centralized security oversight
- Accelerated incident response
- Automated compliance tracking
- Comprehensive vulnerability tracking
Book a Demo Now
Audience
How to Create an IT Operations Dashboard?
The right approach always works, whether building something from scratch or optimizing an existing setup. This ensures you have the right IT dashboard tools for infrastructure monitoring that deliver clarity, accountability, and business value. Here is a step-by-step guide to help you build a high-impact IT dashboard that truly drives performance.

Tool selection can make or break your dashboard project. At X-Byte, we specialize in different tools and leading platforms depending on your existing tech stack and integration needs.
An effective dashboard is as intuitive as it is insightful. Focus on clean layouts, minimal learning curves, and personalized views for different users.
A status dashboard is a missed opportunity. We unlock the real power of operational intelligence through integrative live data streams from across your IT ecosystem. We also ensure data is refreshed in real time or at actionable intervals.
Once your dashboard is built, it’s time to test it in real-world conditions. We conduct user acceptance testing and make iterative improvements. A good dashboard evolves with your organization, so you can continue referring to it to meet shifting priorities and user needs.


